With the general update of all our remote data collection features, and with the launch of iMotions Online, our first fully browser-based human insights platform, approaching, we are releasing the latest integration of our webcam-based eye tracking algorithm – WebET 3.0. To that effect, we decided to put the algorithm to the test with the largest validation study in iMotions’ history, and also the largest validation study in the field of webcam-based eye tracking.
In this article, we go through the findings from the validation study, looking at accuracy across demographics, lighting conditions, connectivity issues, and within Areas of Interest (AOI). After reading this article people interested in our proprietary webcam eye tracking algorithm and iMotions Online should have a better understanding of how accurate the software is.
Note on citation and source material.
Parts of this article are excerpts from the webcam eye tracking validation report, which can be found here, while others are excerpts from the webcam eye tracking whitepaper which can be downloaded here.
What is webcam-based eye tracking?
Webcam-based eye tracking utilizes a standard webcam to track and analyze eye movements and gaze patterns. By employing computer vision algorithms, it offers a cost-effective and accessible approach to eye tracking, finding applications in neuroscience, research, gaming, and human-computer interaction without needing specialized hardware.
Why should we always validate algorithms?
The reason why we decided to conduct the largest and most demographically diverse validation study in iMotions’ history, is because validating algorithms is immensely important in ensuring their reliability, effectiveness, and ethical use.
These studies play a crucial role in assessing the algorithm’s performance, identifying any biases or shortcomings, and validating its intended functionality. By subjecting algorithms to rigorous validation processes, we can evaluate their accuracy, robustness, and generalizability across different datasets and scenarios.
Moreover, validation studies help in uncovering any unintended consequences, such as algorithmic bias or discriminatory outcomes, enabling us to address and rectify these issues. Ultimately, conducting validation studies instills confidence in algorithmic systems, enhances transparency, and promotes responsible deployment, fostering trust among users and stakeholders and minimizing potential risks and negative impacts.
Another important reason to validate algorithms, especially ones made for data collection, is that it might bring new light on findings from the whitepaper. While a whitepaper evaluates, in detail, which factors can influence, in this case, webcam-based eye-tracking, a large-scale study such as a validation study sheds light on what a representative sample would look like for researchers and which of the factors isolated in the whitepaper dissipate in a large sample and which ones are more likely to amplify.
Methodology, Data Collection, and Results
We set out to answer five questions that we know are of vital importance to our global user base, and how they can gain value from using our webcam-based eye tracking functionality. In this section, we take a look at how we approached the study, collected our data, and what we found from the collected data.
Aim of the study and methodology
There were several reasons why we were adamant about conducting the largest validation study we possibly could. Most important was of course ascertaining the accuracy of the webcam eye tracking, but there was more to it than that.
We wanted to make sure that we launch an algorithm, and thereby a platform, that can be used all over the world without algorithmic bias – a common pitfall, particularly with human-centric methodologies. That is why we validated our algorithm on a truly global and representative participant group, across ethnicity, gender, age, and other factors such as people wearing glasses, and whether they have facial hair or not – these are all factors that can cause disruptions in the data collection process for many web-based eye tracking algorithms.
The remote data collection process
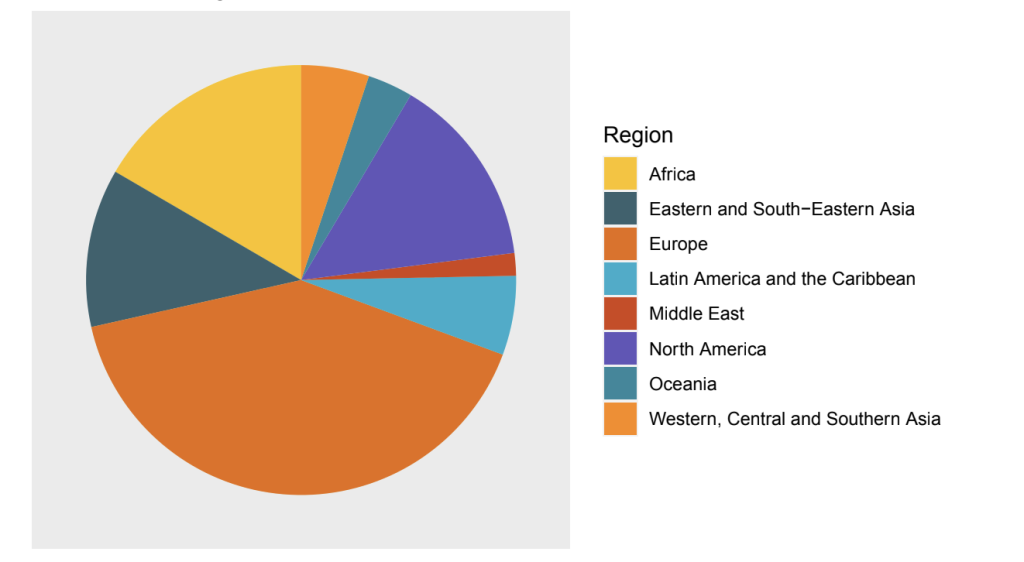
When we ended the study after a total run-time of 35 days, we had collected data from 255 participants. In order to emulate the process that we know a majority of our clients use to recruit participants online, we collected data through our own external mailing lists, geographically targeted emails, and through a paid panel provider, Prolific.
The actual process of getting people to take the study gave us some interesting insights into the data collection process, which might be enlightening for people planning remote data collection. First of all, we found that when you rely on people’s goodwill to answer your study, a majority of participants will abandon the study before completing it.
We distributed the first wave of study invitations through our monthly newsletter, and the study-abandonment rate was 2:1 in favor of abandoning the study. After that, we tried to geographically target demographics in Asia and Central Asia through email, and that had a better effect – but still, the abandonment rate was high. Finally, we decided to use a paid panel provider, Prolific, and that enabled us to reach our target of global representation across demographics.
The result of the process was, as such, nothing new to us. Feedback from clients indicated that study abandonment, and the necessary over-recruitment, is a fact of remote data collection that must be accepted and prepared for. What was surprising was that the abandonment rate was as high as it was.
We had assumed that the people who have signed up for our newsletter would also be inclined to do the study out of interest in the field. However, the truth is that participants have no incentive to keep going if they do not find the study rewarding, or are being rewarded, in some way – which is why when participants were paid, we got all the data we needed.
Validation study results
In this section, we will go through the results of our validation study questions which we mentioned above. Only the main findings will be presented in this article. If you want to see the entire report, you can download it here.
Question 1 – What is the accuracy distribution of a dataset collected with WebET 3.0?
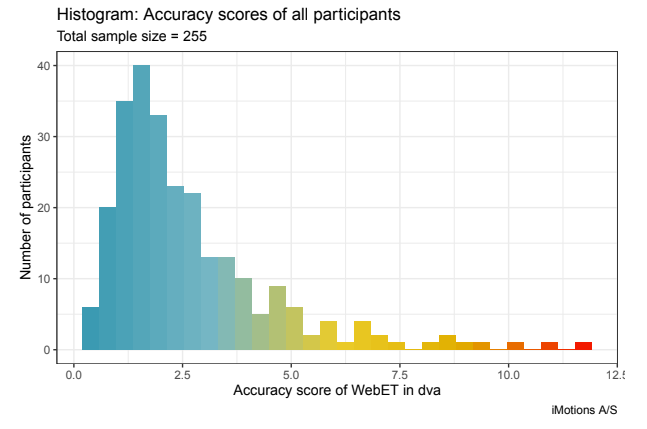
As mentioned before, eye tracking validation is predominantly, if not entirely, about accuracy. In the interest of accuracy validation, we decided to have a hard cutoff of 5.5 degrees of accuracy (DVA) as the upper threshold for acceptable data. Everything below 5.5 DVA was deemed “accurate data”. This is our general recommendation to all webcam eye tracking customers based on our whitepaper, as we expect the large majority of participants to fall well below that cutoff.
Why is it important to have a low DVA in Eye Tracking?
Within eye tracking, accuracy is measured in “DVA” which stands for “Degrees of Visual Angle.” It refers to the angular distance between two points in the visual field. When we talk about low DVA in eye tracking, it means that the eye tracking system can accurately determine the direction of gaze with high accuracy, even for small movements of the eye. You only look at one place at a time on a screen, and it is up to the eye tracker to determine where that is. So, the smaller the area in which it can do that the better – and that is the sign of an accurate eye tracker.
Of the 255 participants collected, 235, or 92%, were below the 5.5 DVA cutoff. Better yet, 70%, or 179 participants, were below 3.0 DVA. This level of accuracy is very satisfactory and is firmly establishing iMotions webcam eye tracking capabilities as state-of-the-art within the industry.
Comments on accuracy metrics.
While the field of eye tracking is well established and has developed over more than a hundred years, It is important to note that the field of webcam-based eye tracking is very new. This means that no consensus on reporting metrics has been firmly established by the companies developing the different software offerings. This in turn means that there are a lot of variations on how accuracy is communicated, and that can lead to significant confusion when trying to figure out which solution fits best to one’s individual needs.
At iMotions, we come from a firm foundation in the field of “classical” eye tracking (screen-based and glasses) which is why we have made the conscious decision to adhere to the agreed-upon accuracy metric of “degrees of visual angle” (DVA) as our metric of accuracy.
This comes with a number of considerations though. When you send out online studies, you have no way of controlling that your participants are following the prompt in the study instructions. There is no way of tracking a participant’s distance to the screen, which means that in order to successfully collect any data you have to make an assumption about that distance that fits most scenarios. This will inevitably lead to some unknown offsets. Which is why this validation study also reports on multiple angles allowing you to make a well-informed decision.
Question 2 – Do individual and demographic variables affect accuracy?
Another central part of the validation study was to ascertain whether the accuracy of the algorithm was equally valid across a list of central demographic variables. Variables such as ethnicity, gender, age, eye color, and if participants had facial hair, or wore glasses.
Having a high accuracy across all these parameters is crucial as it determines whether the webcam-based eye tracking algorithm can be used all over the world, across skin color, eye color, age, and gender. The parameters are also crucial for our users who often work in environments where several of the aforementioned variables are in play in the participant pools at all times.
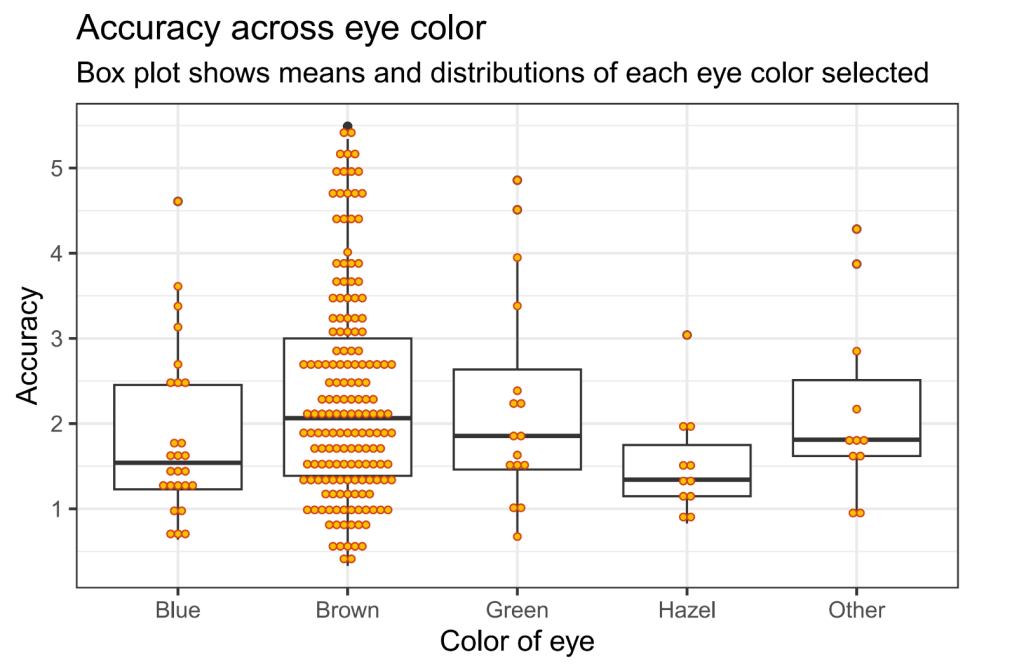
When we concluded the data analysis it became clear to us that our algorithm does indeed hold its accuracy across demographic variables. In short, a study with larger samples such as the present one had no significant differences owing to the self-reported ethnicities of participants, the color of the eye, if they reported having facial hair or not, and their gender or age.
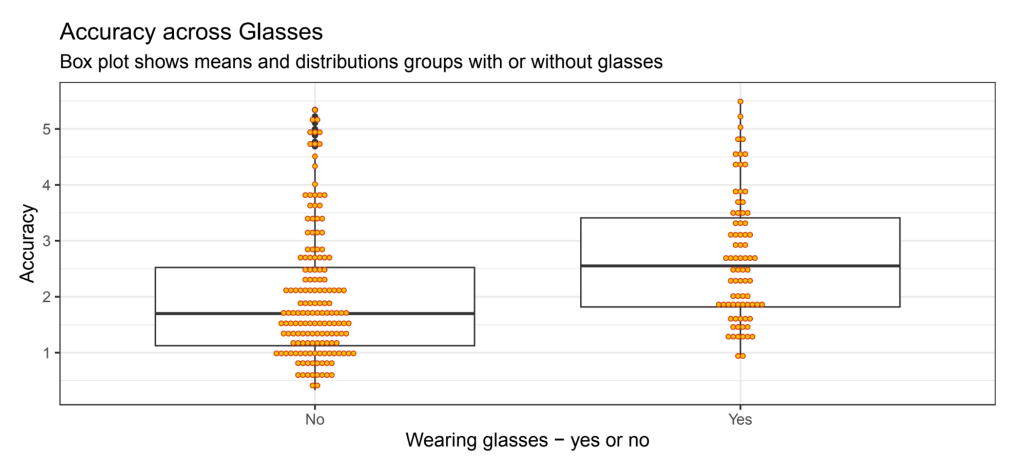
The only parameter that did impact study accuracy was if participants wore glasses. This could be because of the thickness of the glasses, or how they reflected light from the environment and screen during data collection could create interference in accurately identifying the iris. Whether participants are wearing glasses or not may therefore be a factor that you will want to consider when performing webcam-based eye tracking.
Question 3 – How much of an impact does lighting have on accuracy?
One of the pain points of remote data collection is that it is not possible to control a participant’s immediate environment, as you would be able to in a controlled lab setting. All studies sent out through iMotions Online, which WebET 3.0 is integrated into, come with pre-study instructions on how to sit, face the computer, and control the lighting of the room the participant is sitting in.
Even if the instructions given are full, concise and easily followed, the truth is that you can not perfectly control, or redo a study performed online, and you will most likely have to work with what you get. The worst case is that you might have to delete the data altogether if your participant has decided to do the study in suboptimal conditions.
It was important for us to test whether our algorithm was able to eliminate some of the uncertainty faced by researchers and data collectors when building and distributing online studies to participants. The analysis shows that there were no significant differences in accuracy between participants seated in different self-reported lighting conditions.
It is important to note that this does not mean that “lighting does not matter”. The data we collected on lighting and room conditions were entirely through self-reporting. That means that we only have second-hand knowledge of the reality of the lighting conditions Furthermore, only one participant reported being outside during the study – this data was then excluded from testing, meaning that we cannot state whether or not indoor vs. outdoor lighting conditions have an impact on eye tracking accuracy.
Question 4 – How does accuracy change with time?
Another point of uncertainty when collecting data online is the actual process of taking the study by the participants, which can be impacted by lag. By this, we refer to all the technical reasons why the study may take longer than the researcher intended. We designed a task lasting less than 10 minutes comprising surveys, gifs, images, and videos. The length of study, as well as the combination of stimuli, is typical of what most iMotions clients currently use.
Digging into our data, the lag we experienced seems to come from internet issues on the participant end. Especially in participants who took more than 25 seconds to look at a 12 or 19 seconds video – or 5 seconds longer than intended. While some participants did indeed face internet latency issues, these issues did not have a significant impact on study accuracy.

While latency issues are to be expected when conducting global studies, it is important to keep the human factor in mind. Issues of any kind run the risk of impacting the study experience and may reduce participant compliance. lead to restlessness, moving, or study abandonment.
Question 5 – How does the accuracy translate to using AOIs?
An integral part of measuring accuracy is the ability to detect fixations on specific parts of the screen. To emulate that we used cat gifs, positioned in a grid on the screen in nine places. When the individual gifs were displayed on the screen in each study, that allowed us to see how accurate the gaze fixation was.
What we found in the study data was that the number of participants on whom fixations can be detected is highest in the center of the screen and reduces towards the lower corners of the screen. Likewise, over the course of the study, a portion of the participants whose gaze could not be identified, and therefore not classified, increased.
This is most likely due to the fact that participant compliance reduces over the course of the study if the participants are feeling like they have a bad user experience. That is why we advise that studies be kept as short as possible, so as to avoid study abandonment or accuracy issues in the finished studies.
Conclusion
We are incredibly pleased with the data we have collected and the results of the analysis. We have built an algorithm that outperforms the industry in terms of overall accuracy and is not affected by demographic variables. This proves that users of iMotions remote data collection features can safely and confidently apply the platform to participants all over the world, without the risk of not getting enough representational data, as it works consistently across demographics.


