In-store shelf testing helps businesses optimize product placement and design by understanding consumer behavior. Using biosensors like eye tracking and EEG, retailers can measure attention, engagement, and decision-making to enhance the shopping experience and boost sales. Discover the power of data-driven shelf optimization.
Table of Contents
- Why In-Store Shelf Testing is Essential for Retail Success
- Top 3 Methods for Effective In-Store Shelf Testing
- Challenges and Limitations of Traditional Shelf Testing
- How Biosensors Deliver More Accurate and Actionable Consumer Insights
- How to do Product Shelf Testing
- How to Collect Data That Captures Customer Attention and Boosts Sales
- Conclusion
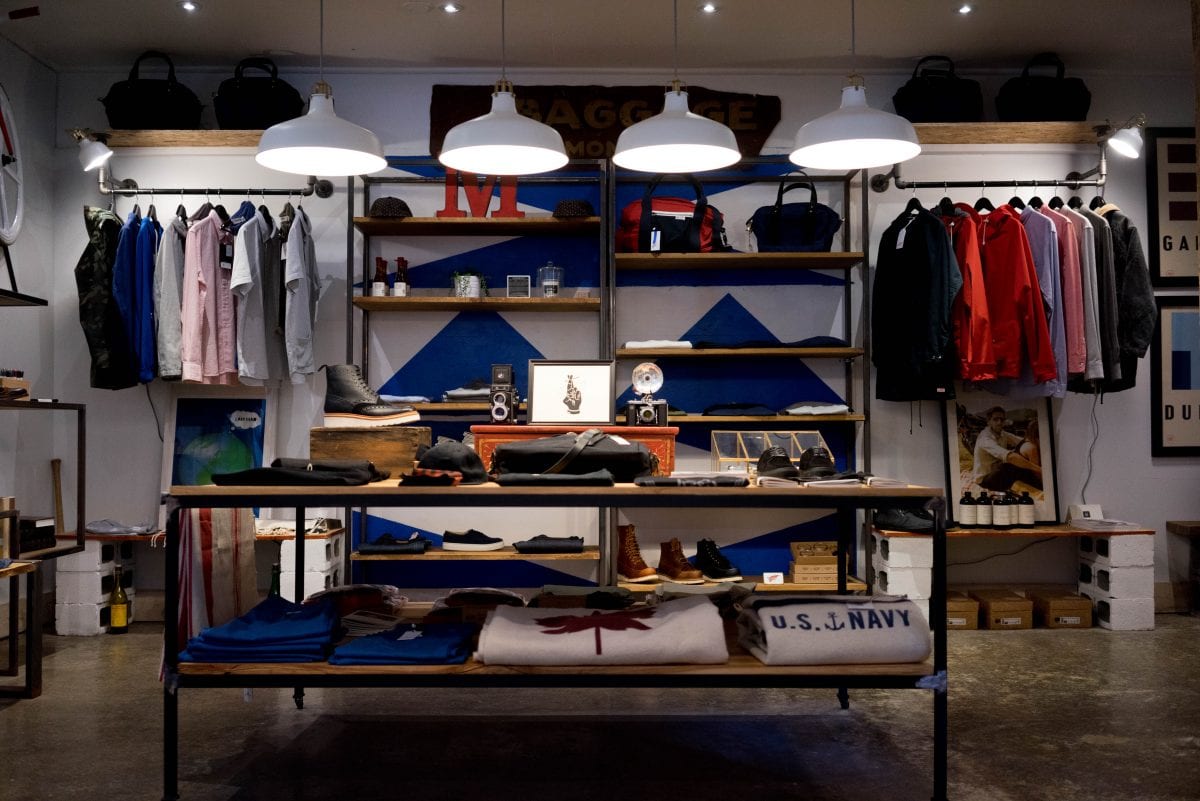
If you want to improve the in-store experience of customers, you need to first understand what their in-store experience currently is. By testing how an individual responds to different environments, you can understand what pleases them the most, and keeps them coming back as customers.
The shelf is the critical point at which customers are engaged in-store. It’s here where the attractiveness of placement and products combine, and can lead to the customer purchasing a product – or walking by without noticing.
In order to optimize the experience at the shelf, testing is vital. Finding the pain points and aspects of attraction can help you choose what works, and remove what doesn’t. By having a shelf that attracts customers, you can create a better in-store experience for both consumers and retailers.
Why In-Store Shelf Testing is Essential for Retail Success
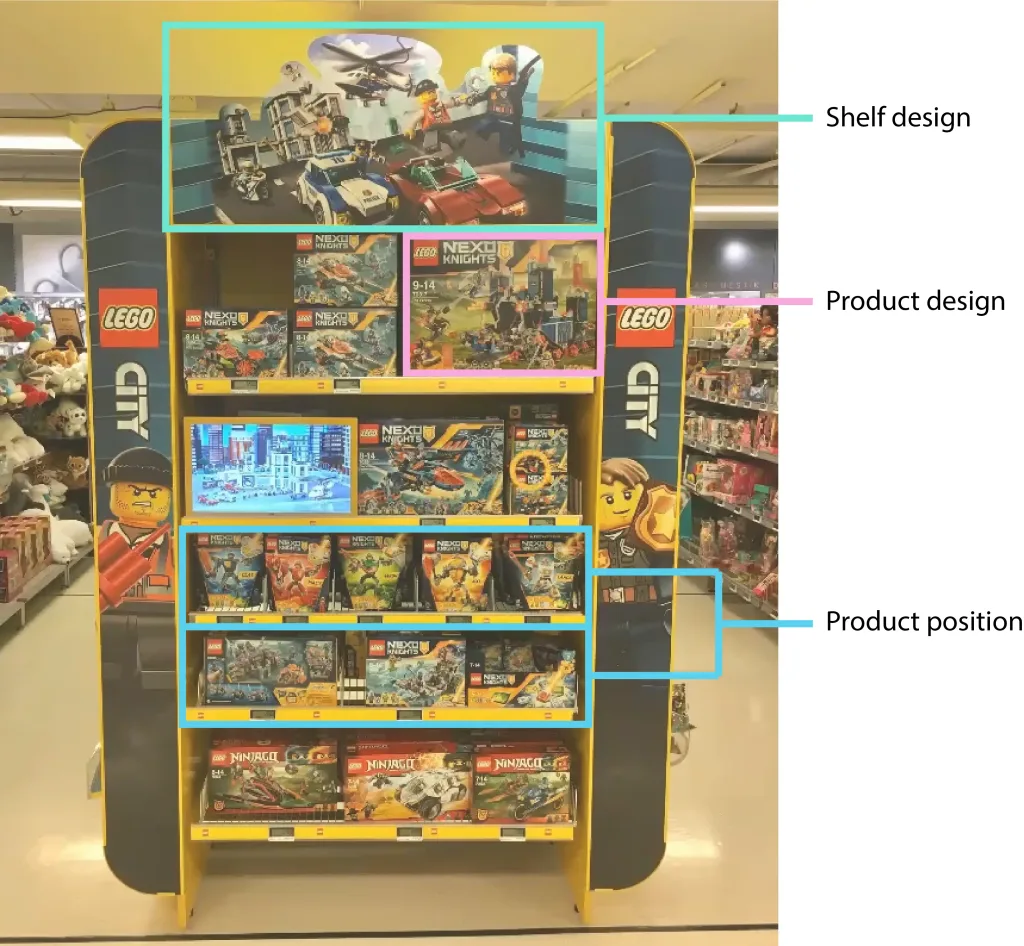
There are various different reasons why you might want to change the shelf setup, and various different ways in which to carry out tests. For the shelf setup, there are three principal reasons for testing:
- To ensure the best product design that stands out on the shelf
- The best position of the product
- The best shelf design itself, in order to bring consumers closer.
Top 3 Methods for Effective In-Store Shelf Testing
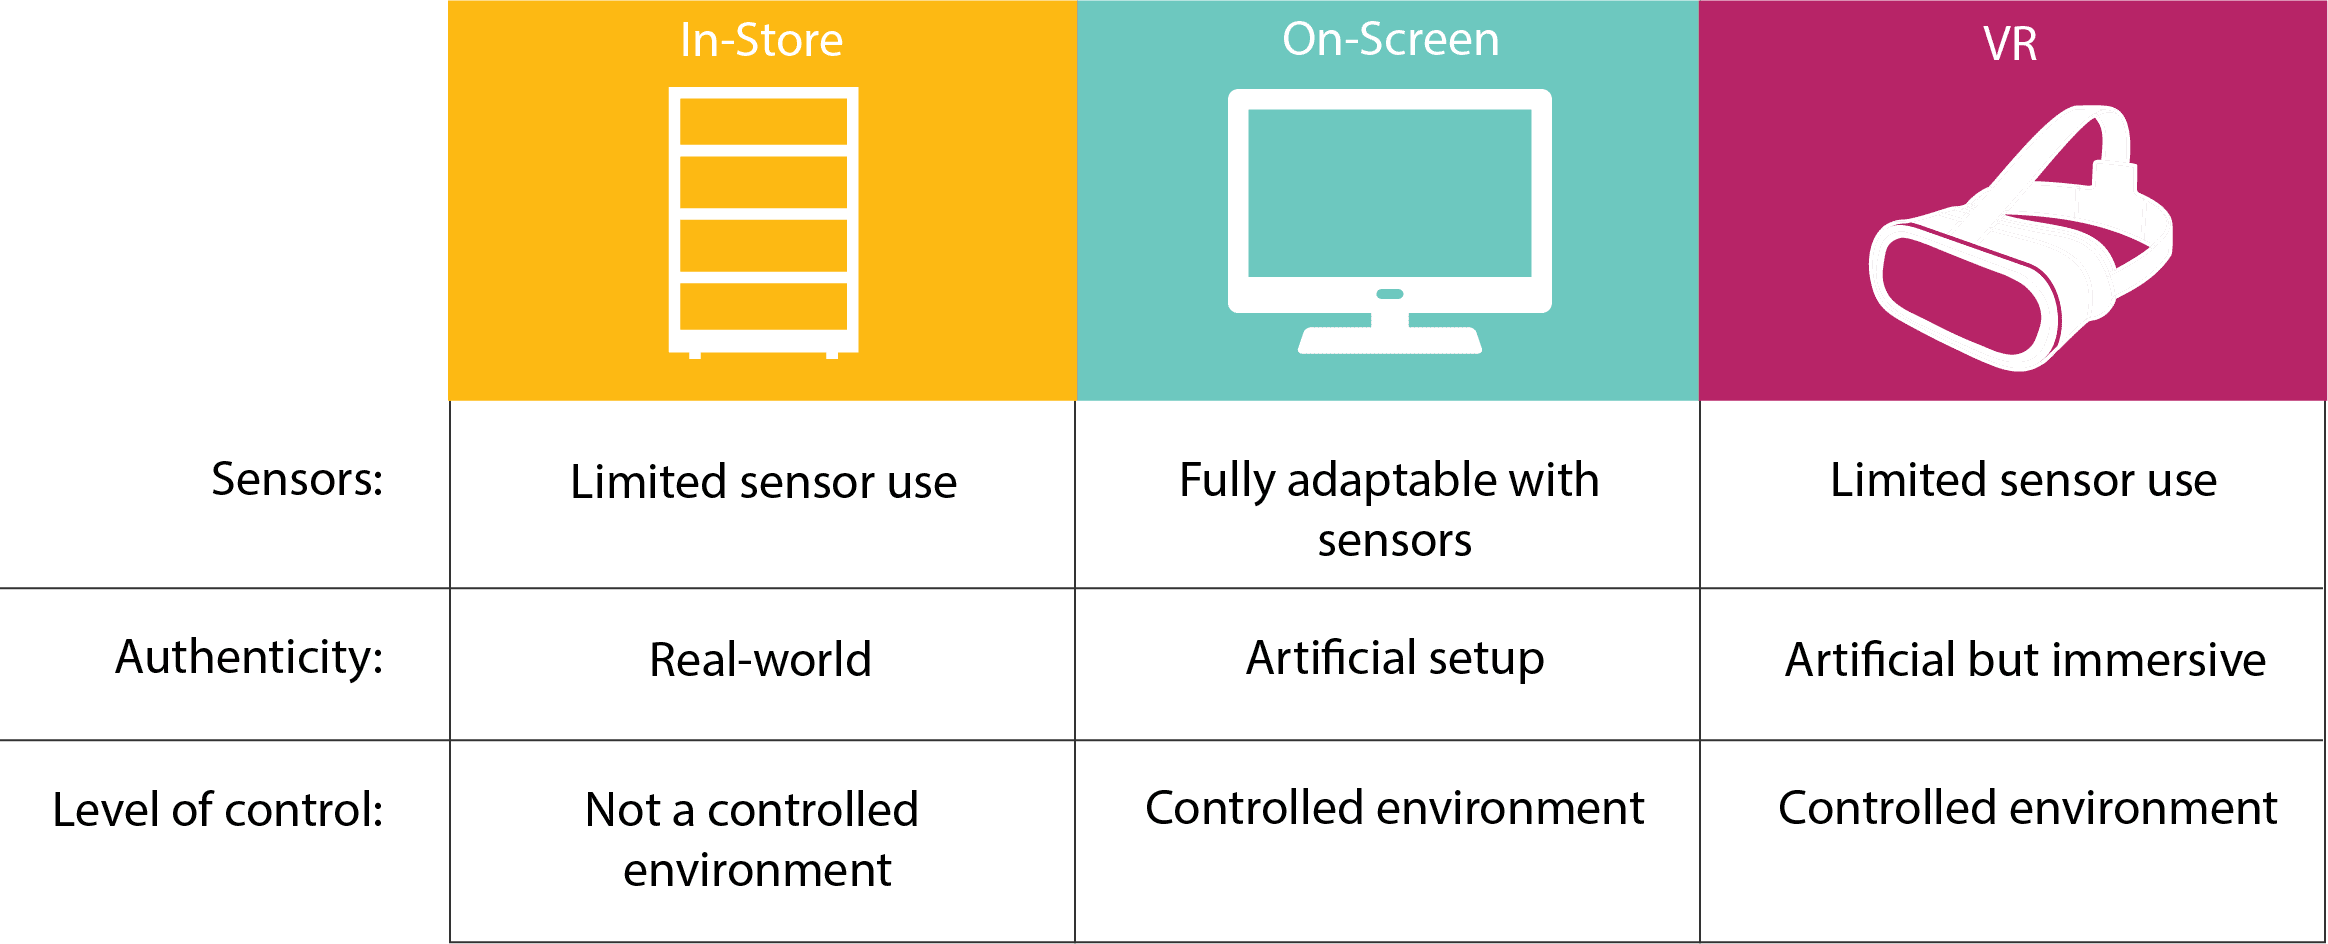
With regards to testing, there are also three main ways in which this is carried out. Either through real-world in-store testing, on-screen in a lab environment, or through virtual reality. The latter two approaches are typically called planograms (rather than shelf testing). There are pros and cons to each of these approaches (some of which are outlined below) – what you ultimately choose to do will depend on your research aims and requirements.
- Real World in-store testing
- On Screen in a lab environment
- Using Virtual Reality
Challenges and Limitations of Traditional Shelf Testing
Traditional approaches to in-store and shelf-testing have meant that respondents were asked a series of questions (through surveys or interviews) about their experiences. This is an approach that of course yields answers – but answers that are unavoidably biased, and in many cases unquantifiable.
When a respondent is retrospectively asked about their experience of the shelf set-up, we rely on the accuracy of their memory and their ability to give a true, unfiltered response. Both of these difficulties create unreliable findings, and in combination, their effect can be particularly damaging to the validity of the results.
How Biosensors Deliver More Accurate and Actionable Consumer Insights
By using advanced techniques such as biosensors, we can begin to delve into a deeper and more reliable understanding of how people think (for shelf-testing, but also in any other real-world scenario too).
Biosensors provide the means for quantifying unbiased data, giving new and unique insight into how an individual responds to an in-store scenario, such as with shelf-testing. Eye tracking, for example, can provide information about how long (or even if) a respondent actually looked at the shelf, as well as the order in which they looked at the items.

The real strength of biosensors within this setting is the combination of tools that present a holistic view of a respondent’s thoughts, feelings, and behavior. Using eye tracking alongside EEG (electroencephalography) measurements provides data about the real-time brain response to the features of the environment. Automated metrics can also detect how motivated, engaged, and how much cognitive workload a respondent is experiencing.
Each of these metrics completes the view of the eye tracking data in different ways. If a respondent spends a lot of time viewing a sign or product, is that because it’s appealing or because it’s confusing? The levels of cognitive workload can tell you if they’re just confused, while the levels of engagement and motivation tell you if the respondent wants to approach further.
Check out: How Biosensors are used in product development
When testing in planograms, there is an even greater possibility to add further sensors to the experimental setup. Using facial expression analysis can be a great way to deduce the emotional state of the participant, telling you about how the product or scenario is perceived. It’s also possible to add GSR (galvanic skin response) measurements in order to understand the physiological arousal of the participant at a quantifiable level.
This method of implicit investigation can be used in combination with the traditional question and answer approach, meaning that what a consumer says can be weighed against the evidence. If a participant is verbally saying that they found something interesting, or boring, but all their biosensor evidence points otherwise, it might be time to discount what they say, and listen to the data.
How to do Product Shelf Testing
So how does it all work? How can you test a shelf set-up in the optimal way? First, there are some essentials that you need to cover. Eye tracking is going to be a must; you need to know what they were looking at, and at what time (whether or not this is through a mobile or stationary eye tracker will depend on whether the experiment is carried out in-store, or is through an onscreen planogram).
Synchronizing this eye tracking data with other measurements is the best approach to maximize the power of your findings. Using EEG alongside eye tracking is a quick and unobtrusive way to get a better look at a respondent’s cognitive reactions.
To begin the process, you will first need to recruit respondents – how you do this depends on your approach (you may want to recruit people already at the store, who are representative customers – or put out a call for other people, who might be more representative of the population at large).
Once you have your respondents, you will need to connect them to the sensors before they browse the store for the shelf of interest. Setting up eye tracking (glasses or stationary), is simply configured with a quick calibration. For EEG, you will need to apply electroconductive gel, or use a dry-electrode headset. Setting up facial expression analysis or GSR is a simple process, requiring just a webcam and attachment of electrodes, respectively.
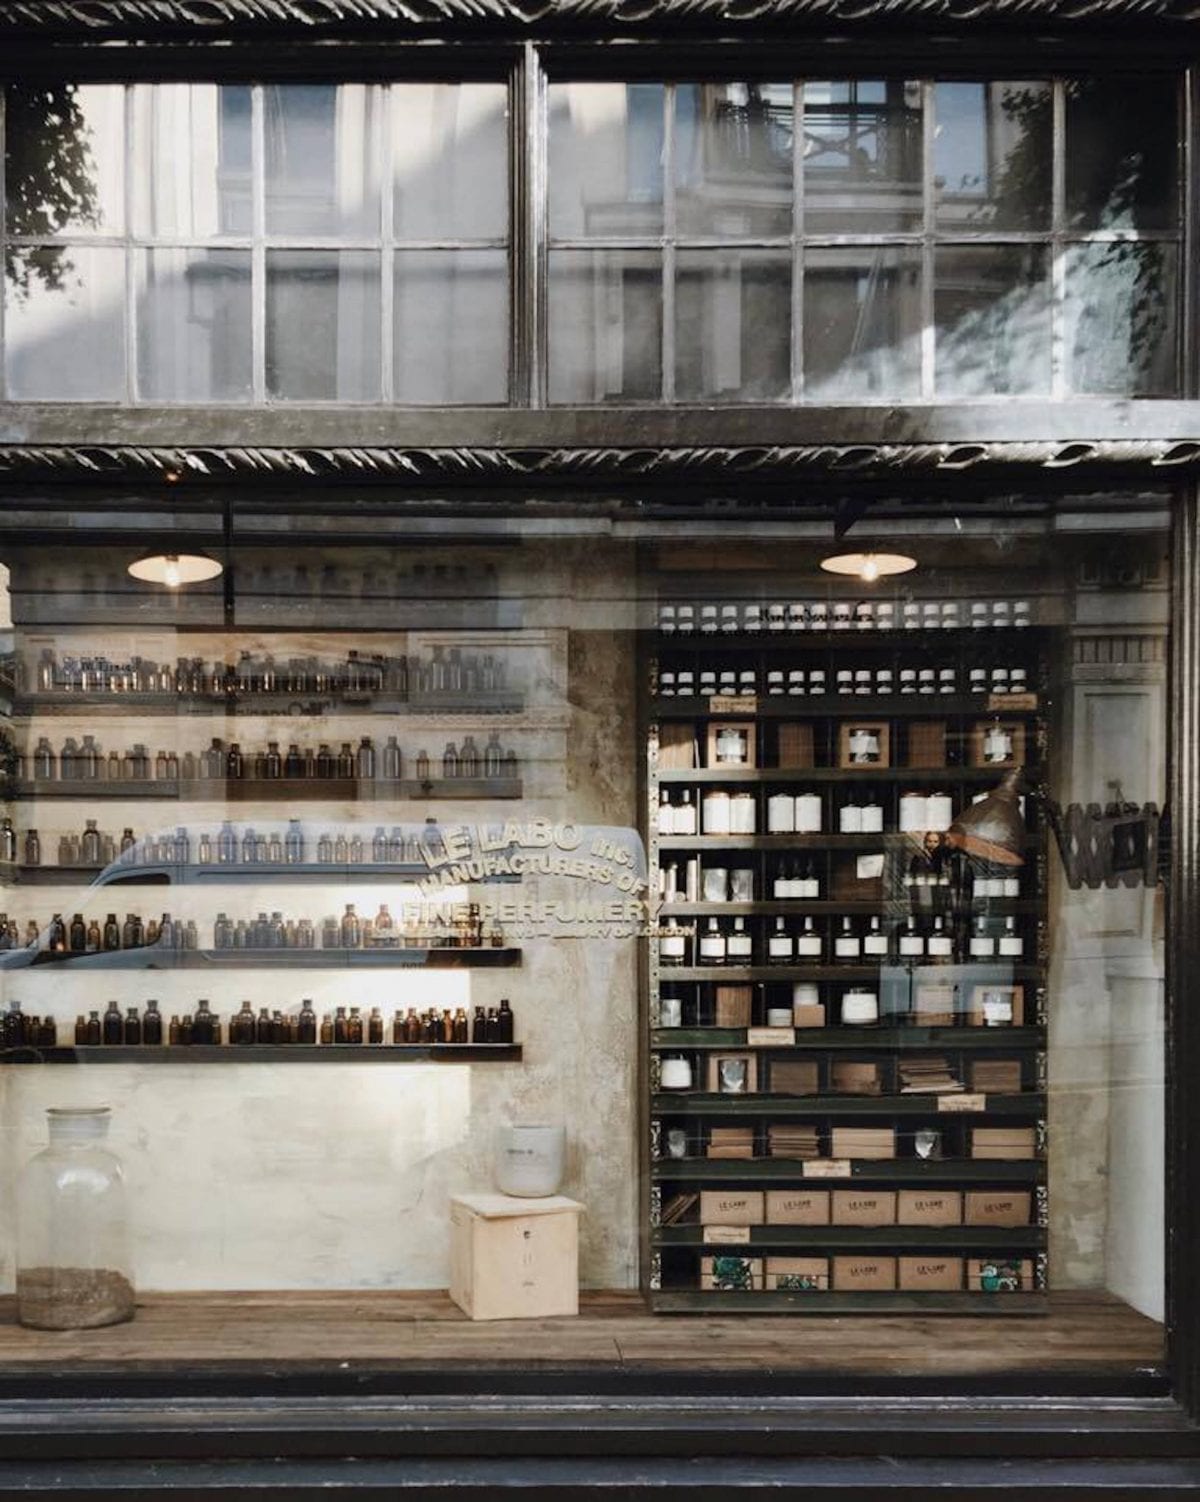
Respondents are typically asked to complete a specific, and a non-specific task. In the former, they will be required to find a particular product (where a set brand and item need to be found), and in the latter they will be asked to find a product in more general terms (for example “find and choose any organic fruit”).
The non-specific task can be used as a baseline, to see how (if at all) a respondent would react or notice a product in a more natural setting. They’re not, at that moment, looking for a set object so their responses don’t reflect any biases.
Once the equipment is attached and running, the data can be synchronized and viewed in real time in iMotions. The respondents can then go out onto the shop floor (in the real or virtual world), and the researcher can view how they see and experience the world as they browse the shelves.

How to Collect Data That Captures Customer Attention and Boosts Sales
With the data collected, there are a few things that should be done before any conclusions can be made. First of all the quality of the data should be inspected. This can be done directly in iMotions, with the percentage of usable data immediately displayed. Once checked, the information can then be viewed directly in iMotions, or exported for further analysis.
Within iMotions, you can view eye tracking information alongside data from your other measurements, such as EEG or GSR. By being able to quickly see what the respondent is looking at, and how it made them feel, you can get an idea of how the setup was perceived.
To quickly understand the way in which a product shelf was seen, the eye tracking data can be converted into various metrics – such as the time to first fixation (TTFF), or the duration of the visual fixation, among others. These metrics reveal how a participant sees the world – which features were most salient, which ones were the least attractive. Using this information takes you some of the way in understanding how the shelf setup performs.
Check out: Gaze Mapping in Advanced Eye Tracking Research
The TTFF is particularly important, as it literally reveals how eye-catching a product, or component of the shelf setup is. The fixation duration can also be revealing, and is best combined with a measure such as EEG in order to determine the cognitive state of the respondent.
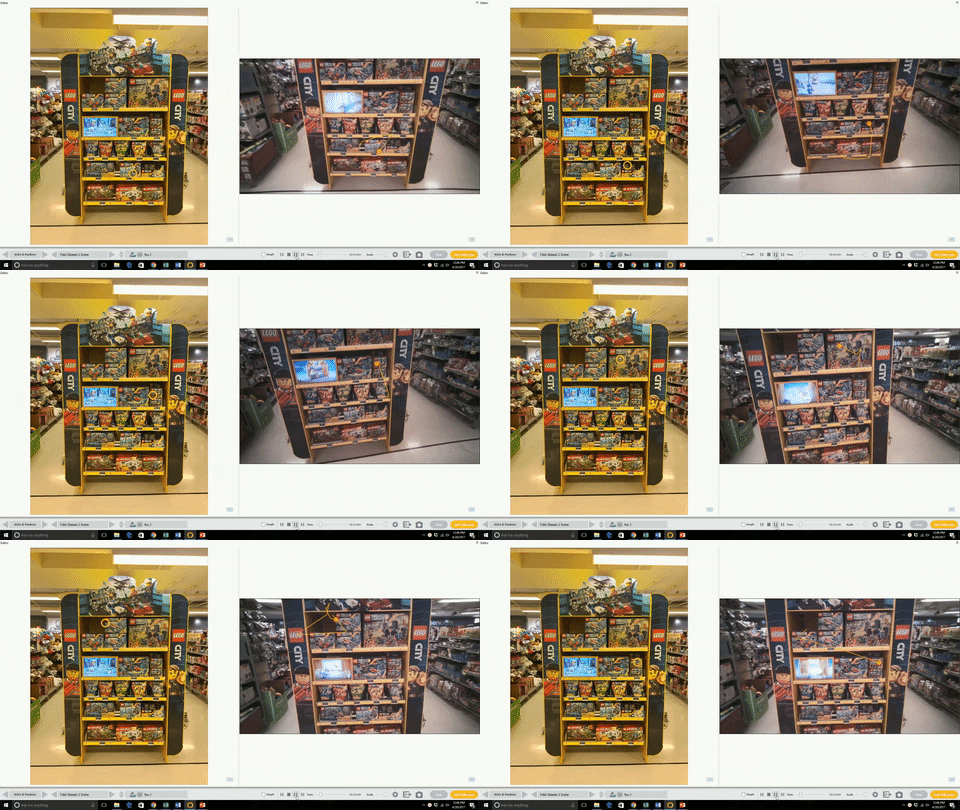
A unique feature of the iMotions platform is the ability to carry out gaze-mapping on a shelf setup. The software is able to automatically track the position of the respondent to the shelving, meaning that you can view how the respondent sees the shelf, even if they’re standing far away, or walking past. The image below shows how this appears in the analysis stage.
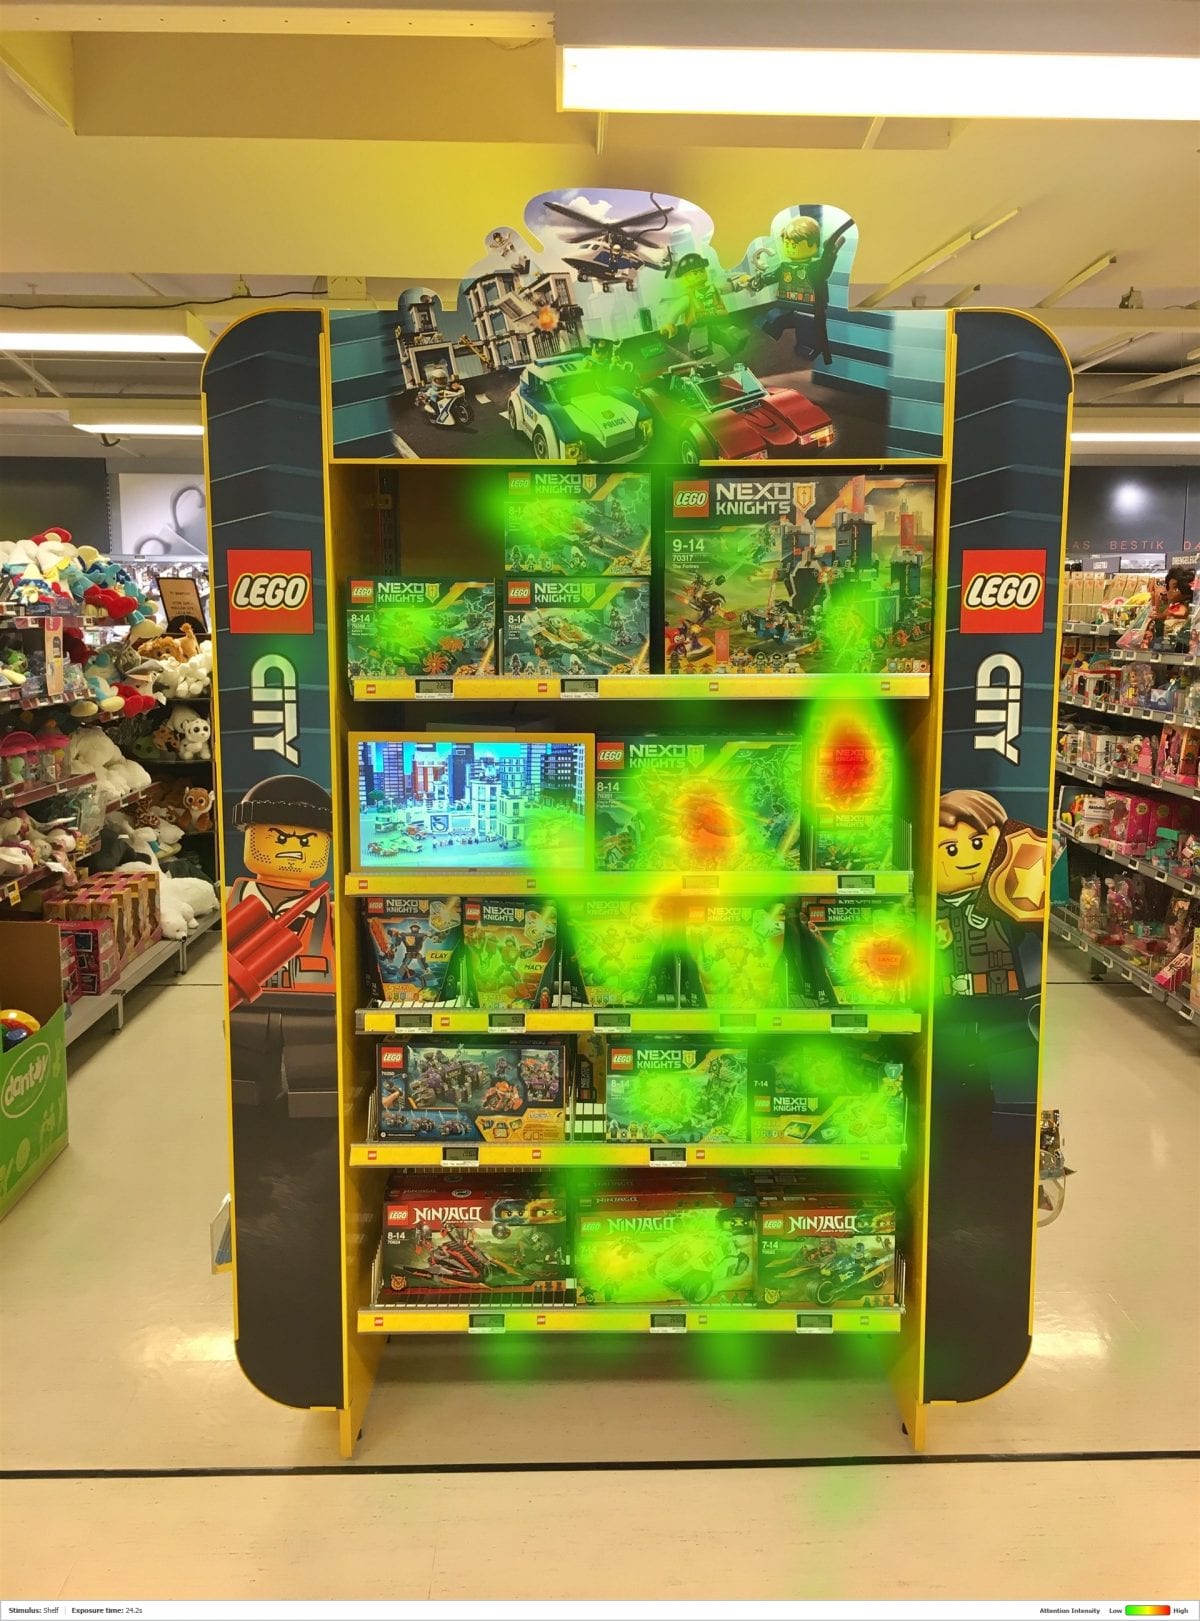
Heat maps can also be generated over the image of the shelf, which allows a much quicker comparison to be made across participants of how they view the shelves, even if they didn’t look at the setup from exactly the same angle, or in the same way.
As for EEG, the levels of engagement, distraction, and other metrics, are automatically calculated, providing a quick insight into the respondent’s overall cognitive state. Combining all multiple measurements can therefore tell you what scenario worked the best, by knowing not only what they looked at and for how long, but also how it made them feel and think.
Learn how to Research Consumer Behavior
Conclusion
With these metrics analyzed, and different shelving setups tested, you can define what does – or doesn’t work. By refining the arrangement and design, the efficiency and enjoyability of the system can be maximized – giving you the greatest possible impact on the consumer.
Overall, the combination of biosensors as a method of investigation is where real, valuable insights can be found. The strength of the findings ensures that in-store testing doesn’t have to be an endless battle – robust conclusions last the test of time.
I hope you’ve enjoyed reading about how to do in-store shelf testing – If you’d like to know more about biosensors, then start with our free guide to eye tracking which you can download below.
Improve Your Customer Experience and Increase Profits
Get the data insights to drive measurable changes to in-store experiences with iMotions Product Design and Testing Lab.
