Heat maps are powerful data visualization tools that help analyze and interpret complex information. This article delves into techniques for effectively utilizing heat maps to extract valuable insights. Discover how to leverage this visual aid to enhance decision-making processes and gain a deeper understanding of data patterns, trends, and correlations.
Table of Contents
Heat Maps At A Glance
A majority of people who have general knowledge of eye tracking will likely associate it with heat maps. These colorful visualizations of data are powerful tools that are universally applicable when working with eye tracking. In this article, we will go through how to analyze and interpret heat maps.
In the 1950s, at the dawn of the computational revolution, scientists were presented with a kind of problem that they had rarely encountered before. It was a problem that few had seen coming, and new methods were urgently required to treat it. However, in spite of their best efforts, the problem still persists to this very day. What exactly was the problem? Too much data.
The rise of computers allowed easier and more streamlined data collection, leading to large-scale datasets that required suitably large-scale analyses. One of the outcomes of this sudden need for new analytical methods was the invention of heat maps. Originally used with taxonomical datasets, the applications to other areas were soon obvious and embarked upon.
Around the same time, researchers had begun developing eye trackers in a similar vein to their current, modern form. It didn’t take too long for these tools to collide, and eye tracking heat maps were born. These heat maps provide clear and accessible representations of dynamic processes, advancing our understanding of the data at hand.
Let’s talk!
Schedule a free demo or get a quote to discover how our software and hardware solutions can support your research.
But what does a heat map really show?
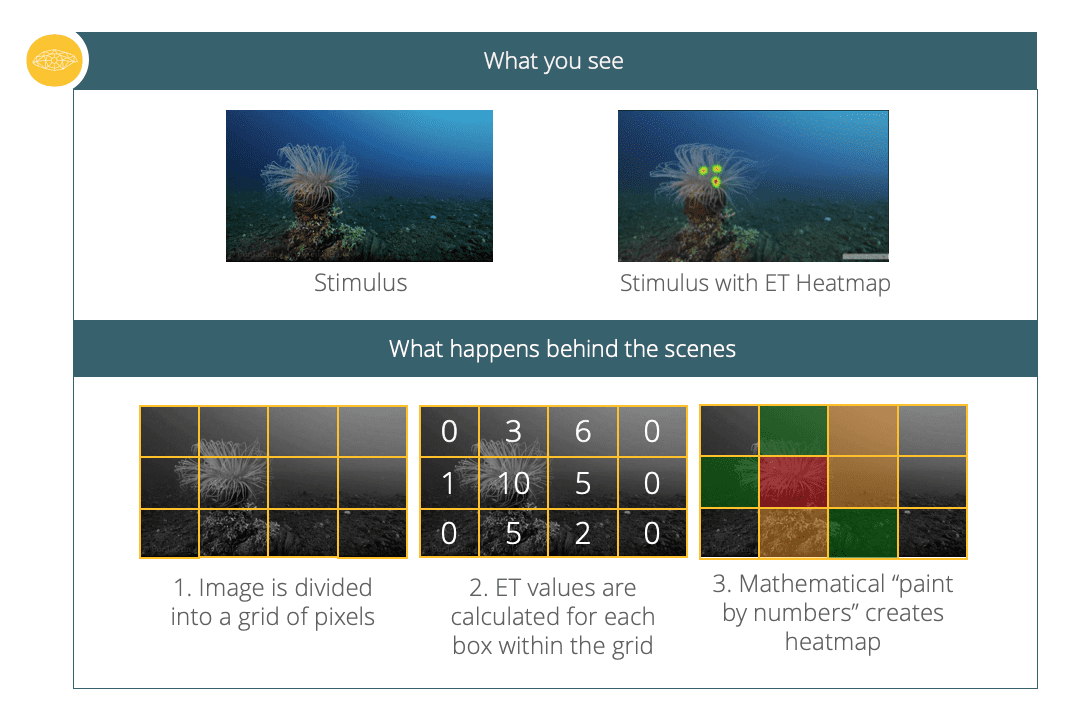
You can think of a heat map as a data-driven “paint by numbers” canvas overlaid on top of an image.
In short, an image is divided into a grid and within each square, the heat map shows the relative intensity of values captured by your eye tracker by assigning each value a color representation. Those that are highest in their value – relative to the other present numbers – will be given a “hot” color, while those that are lower in their value will be given a “cold” color.
What exactly goes into calculating the numbers themselves?
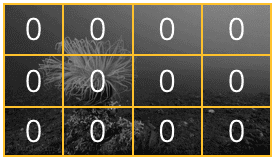
1. Every pixel within the grid begins at “0.”
2. Points are added to the spaces on the grid based on participants’ visual attention. This requires a great deal of calculations!
- Each gaze point gets transformed into numbers within the grid. A gaze point shows what the eyes are looking at – if your eye tracker collects data with a sampling rate of 60 Hz, you will end up with 60 individual gaze points per second.
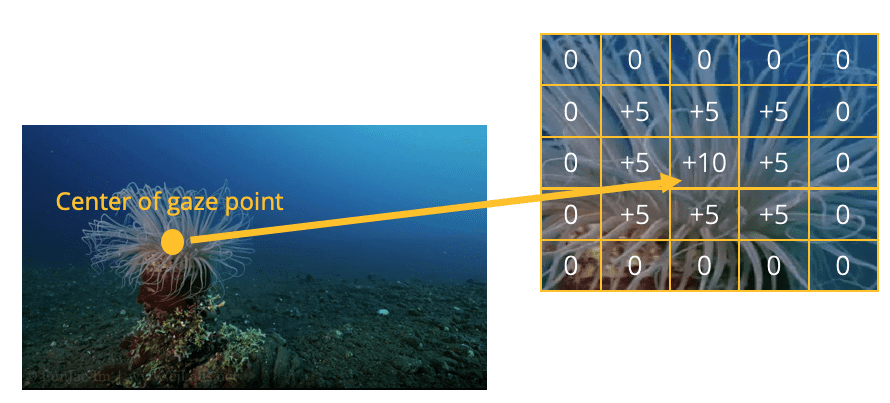
- Each individual gaze point gets transformed into multiple numbers on the grade based on the filter you have selected for your eye tracker. For every gaze point a participant has, the filter is applied to the center pixel of their gaze and assigns it a high value. Based on the filter your eye tracker uses, the surrounding pixels also receive points corresponding to values set in the filter.
- More precisely, the filter generates values that increase the center of the gaze point by a large value, surrounding pixels by a smaller value, and faraway pixels not at all. In the example below, the center pixel is +10, the surrounding +5, and faraway receive no points.
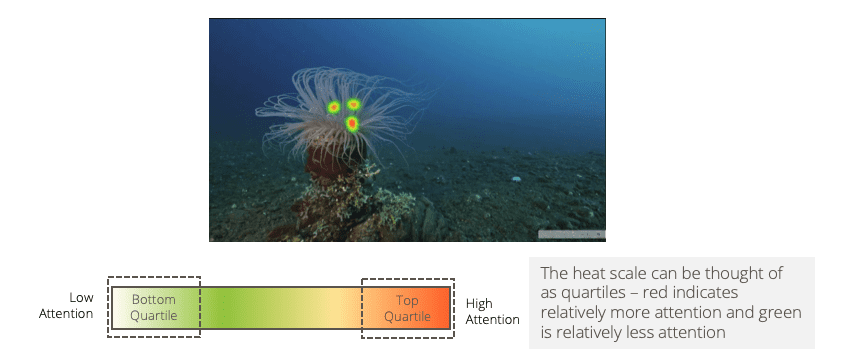
3. When this step is done, we have a “grayscale” heat map where pixels near many gaze points have high values while pixels far away from any gaze points remain at 0.
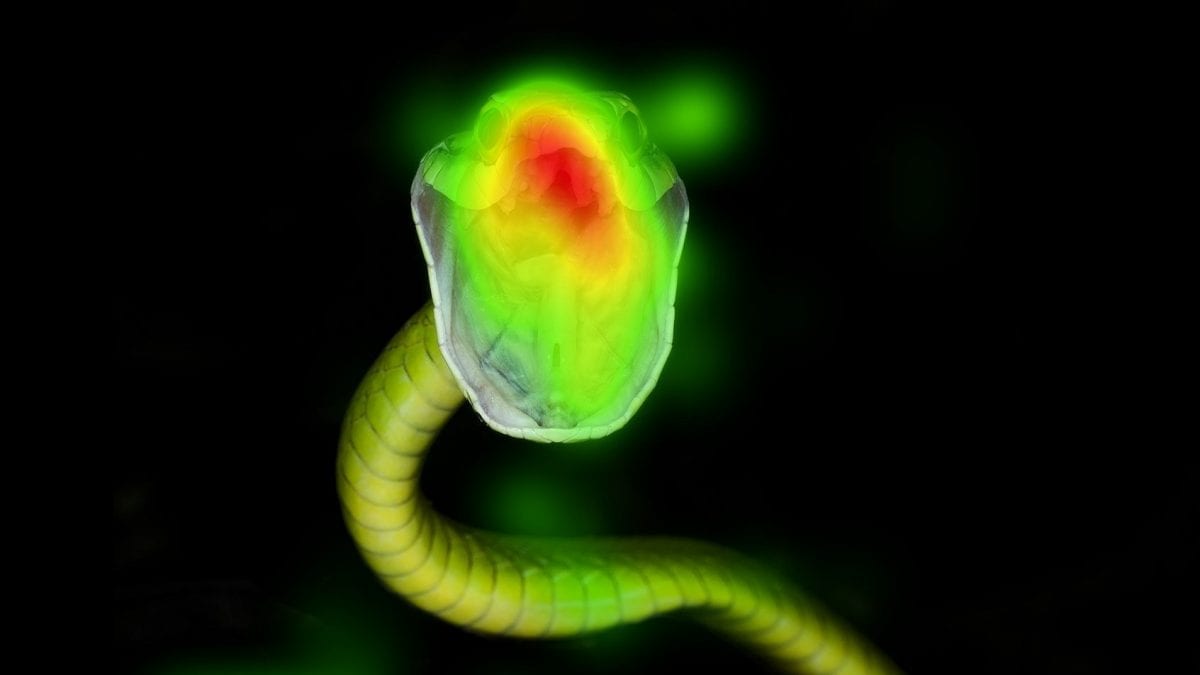
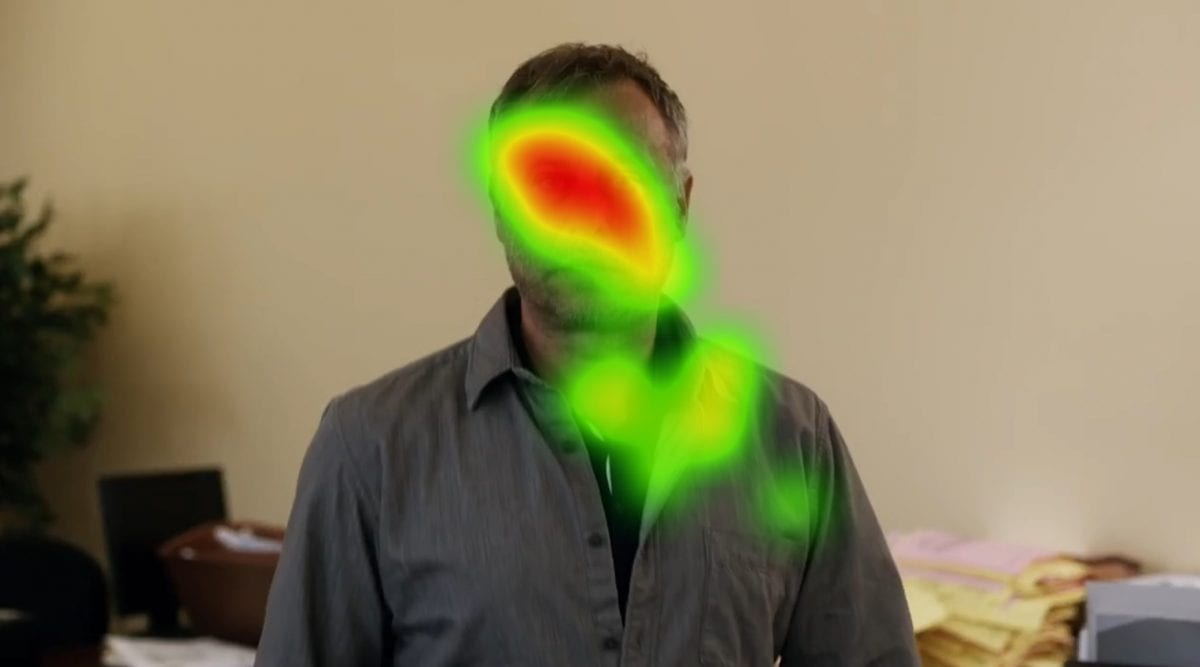
4. Once all of the points have been mapped for all participants who were exposed to the stimulus with eye tracking, the values are translated into a color map. Pure green is the lowest value, pure red is the highest value, and pure yellow is exactly in the middle. All parts of the grid that have a value of 0 remain transparent.
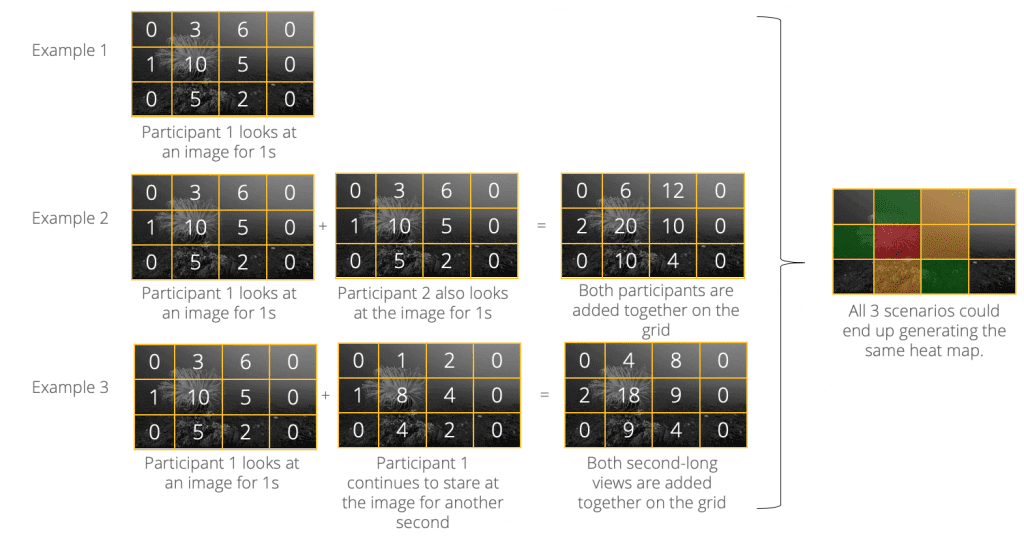
5. Keep in mind that there are many mathematical ways to get the same heat map because the values depend on the scale for that individual stimulus. For one stimulus, “10” might be the highest grid value, while another might peak at “4.” Values can depend on the number of participants or the type of filter you use and whether or not it weighs multiple variables (such as length of fixation) into the final value. Below are some examples that illustrate this point.
If you are curious about heat map videos, the individual frames of dynamic heat maps work in the same way, except that they only use the gaze points captured at that point in time and overlay them on the corresponding video frame.
What should we look at?
There are various ways to carry out data analysis, each of which depends on the research question and the data at hand. While there are various metrics that are captured from eye tracking experiments, we’ll focus on the ones that can be converted into (or from) heat maps.
Gaze:
This refers to the continuous viewing of an image – where we are looking when presented with a visual stimulus. A heat map of gaze data would therefore show which parts were most frequently looked at. If we had specific details of a stimulus we were interested in examining, we would define Areas of Interest (AOIs). If we wanted to know how much time each feature of the image was looked at, we should examine the fixations.
Areas of Interest (AOIs):
We could decide which co-ordinates – regions – are most important to look at (these are known as Areas Of Interest, or AOIs) and define those as part of our analysis. Perhaps our image is of people, and we want quantify the amount that people look at the eyes of others – we could group together the co-ordinates for the eyes, and later compare those numbers against similar clusters, or other AOIs, on the image.
Fixations:
A fixation is regarded as a gaze that is maintained within the same region for more than a passing moment (in practice, this can be defined as within 1 degree radius of vision, and lasting for over 100ms). A heat map built from fixation values therefore shows the number of times in which an individual pays focused attention to a particular part of an image.
Heat maps in iMotions are created by default from gaze mapping data, although they can also be created from fixations – you can decide what’s best for your study. The heat map makes for an accessible and understandable framing of the data, but if you want to know more about what underlies it, then you’ll need to export the numbers for further analysis.

A snapshot of some of the data that can be exported from an eye tracking experiment.
Analyzing The Data
Once you have the data, be it in Excel, SPSS, or another statistical program, you can start to dig deeper into the numbers. Testing the data that underlies a heat map can ultimately be the same as with any other data analysis. To compare differences between the viewing of two images by an individual or group, a t-test could be performed on the data. This can inform you about whether or not there is a significant difference between the amount of gaze or fixation between the two images.
If comparing the results across more than two groups, you might want to consider using a statistical test called an Analysis of Variance (ANOVA), which compares the variance across groups. This is particularly useful in cases in which groups overlap.
Consider an experiment in which you want to measure participant’s responses to different pieces of art. You might have a population that can be defined by their level of interest in art, and their age. An ANOVA allows you to know if young art-lovers are more engaged by the stimuli than older people who are uninterested in art. You could also see if those grouped by a greater interest are generally more engaged, regardless of their age. Any combination of groups is essentially possible.
This provides a brief introduction in essence to the statistical tests, yet the exact applicability and usefulness of each test will depend on the research question, and the data at hand. There are of course many more statistical tests available, offering a great degree of flexibility for analysis.
What can we know from the data?
While the gaze and fixation values can’t tell you exactly what a person is thinking, it can provide insight in other ways. If the gaze or fixation data of a particular stimulus (be it image-based, video-based, or in a real-life setting) is compared to another stimulus, we can know which attracts the most attention, or which is the most salient. If you want to probe further into what an individual is thinking or feeling, then multiple methods can be employed to give you those answers.
For example, simultaneous recording of physiological arousal (such as through measurements of galvanic skin response), and recording of facial expressions can give information about the emotional valence and intensity that an individual is feeling in the presence of a stimulus. Additionally, surveys and psychometric tests can be used to help the participant reveal their thoughts, feelings, or intentions. Ultimately, the use of various biosensors can provide a complete picture of an individual’s response to a stimulus.
While the data from eye tracking studies can be converted into heat maps, it can also be used to provide information about various other metrics, including (but not limited to!) the Time To First Fixation (TTFF), number of revisits, and the ratio of views.
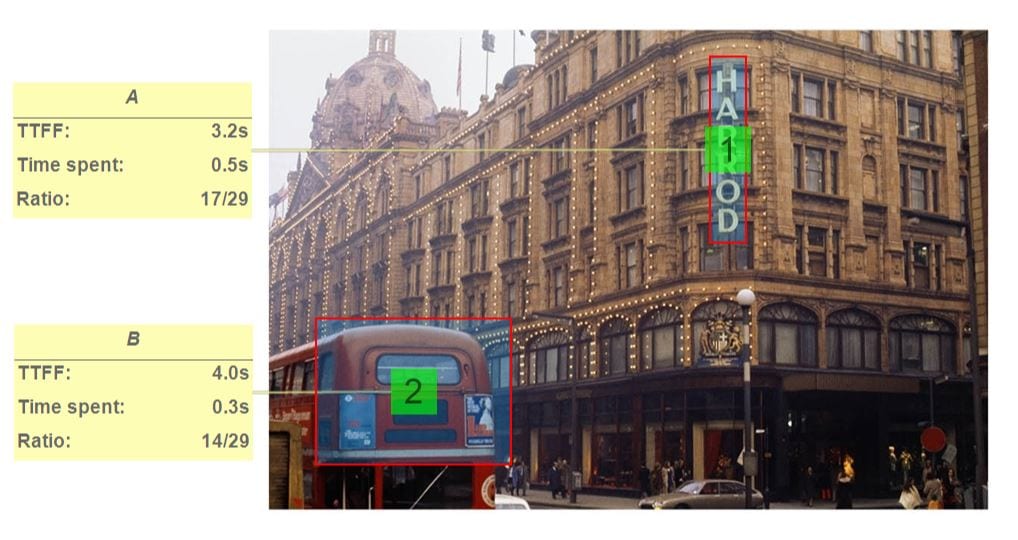
The TTFF relays the amount of time before a participant views a defined part of the stimulus, while the number of revisits can tell you about how many times a certain part of the stimulus is repeatedly viewed. The ratio describes the proportion of participants that actually viewed a set part of the stimulus. Overall, this data can provide a clearer picture about the level of attention that a stimulus receives.
If you’d like to know even more about eye tracking, and how to use eye tracking in your research, then have a look through our free pocket guide. With it, you’ll soon be creating fantastic studies.
/CTA