Discover how your brain’s tiny electrical signals become visible patterns that reveal attention, emotion, and mental effort. EEG uses scalp sensors to capture synchronized neural activity, helping researchers understand how we think, feel, and respond in real time across different brain states.
Table of Contents
Your brain runs the show. Think of the last time you tried to solve a crossword puzzle or started to learn a new language. Recall the last time you woke up in the middle of a weird dream or needed to find your way in a city you have never been to before.
As you think, dream, see, and sense, your brain is constantly active, absorbing all information, compacting and re-connecting existing data, and integrating everything into a consistent experience. For you, that experience constitutes your reality.
Your brain is alive. Your brain shapes how you see your environment, and filters or highlights objects and information most relevant to you. It creates its own stories based on your thoughts, emotions, desires, and experiences, ultimately driving your behavior.
EEG measures the electrical activity of the brain
The brain consists of billions of cells, half of which are neurons, half of which help and facilitate the activity of neurons. These neurons are densely interconnected via synapses, which act as gateways of inhibitory or excitatory activity.
Any synaptic activity generates a subtle electrical impulse referred to as a postsynaptic potential. Of course, the burst of a single neuron is difficult to reliably detect without direct contact with it. However, whenever thousands of neurons fire in sync, they generate an electrical field which is strong enough to spread through tissue, bone, and skull. Eventually, it can be measured on the head surface.
Think of this as a constant rumble of subtle earthquakes. Taken by itself, each burst might be too small to notice, but if several of them occur at the same time, in the same location, and in the same rhythm, they all add up to a mega-quake that will be noticeable even hundreds of miles away.
What is EEG and how does it work?
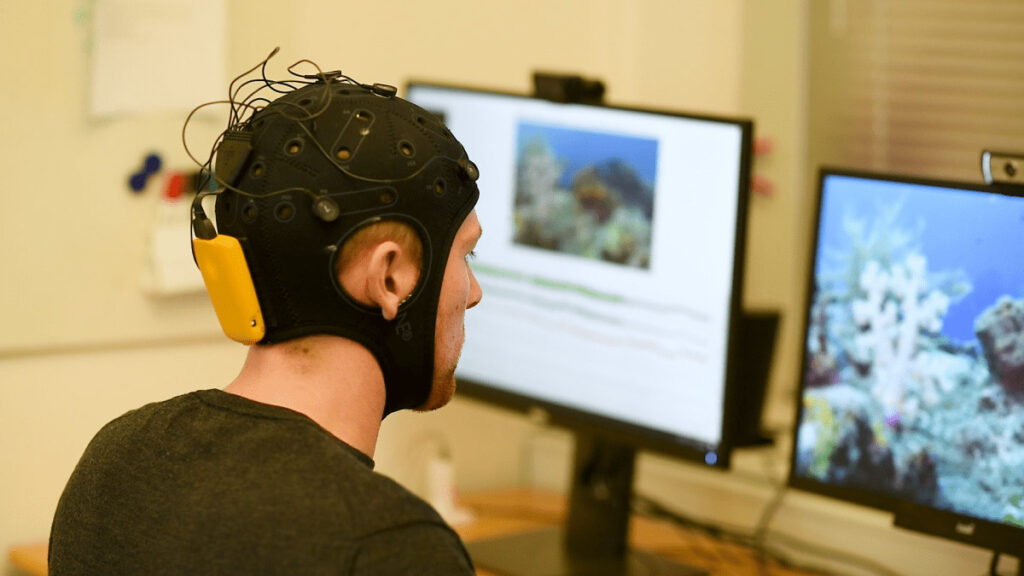
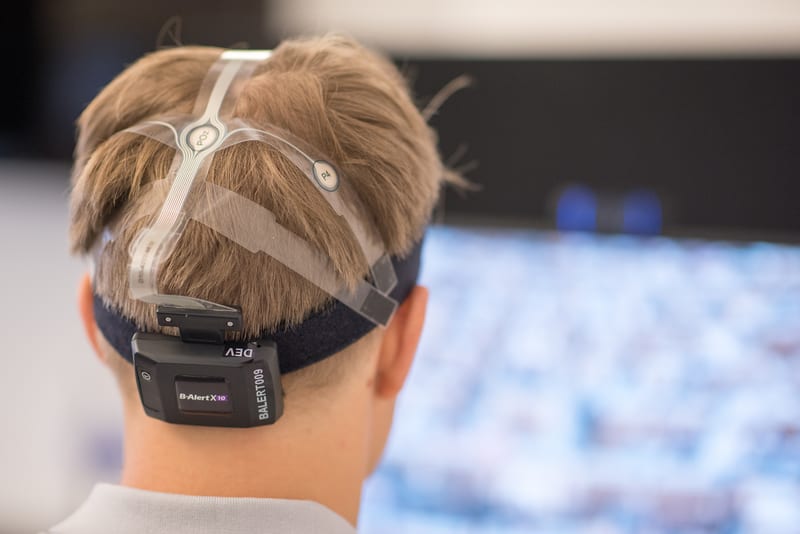
Electroencephalography, or EEG, is the physiological method of choice to record the electrical activity generated by the brain via electrodes placed on the scalp surface. For faster application, electrodes are mounted in elastic caps similar to bathing caps, ensuring that the data can be collected from identical scalp positions across all respondents.
Despite its somewhat daunting name (and pronunciation), grasping the essentials of electroencephalography is surprisingly simple:
To thoroughly understand these foundational elements and their practical applications, we encourage you to explore our comprehensive EEG 101 guide.
To thoroughly understand these foundational elements and their practical applications, we encourage you to explore our comprehensive EEG 101 guide. For a clearer picture of how these principles translate into real-world impact, discover the **most common applications** for human EEG research.
Electroencephalography (EEG) Definition:
- Measures electrical activity generated by the synchronized activity of thousands of neurons (in volts)
- Provides excellent time resolution, allowing you to detect activity within cortical areas -even at sub-second timescales
As the voltage fluctuations measured at the electrodes are very small, the recorded data is digitized and sent to an amplifier. The amplified data can then be displayed as a sequence of voltage values.
Price differences in EEG systems are typically due to the number of electrodes, the quality of the digitization, the quality of the amplifier, and the number of snapshots the device can take per second (this is the sampling rate in Hz).
EEG is one of the fastest imaging techniques available as it often has a high sampling rate. One hundred years ago the time course of an EEG was plotted on paper– nowadays the data is (thankfully) displayed digitally as a continuous flow of voltages on a screen. But that’s just the beginning – you also need to understand what the data is telling you.
While the data is displayed digitally, comprehending its full implications requires understanding the nuances of its collection, processing, and analysis. For a deeper dive into these fundamental concepts, explore **EEG 101 basics**.
What are Normal EEG Waves?
Normal EEG (Electroencephalogram) waves are characteristic electrical patterns observed in the brain’s activity when recorded using EEG equipment. These wave patterns can provide crucial insights into an individual’s state of alertness, relaxation, or sleep. Recognizing normal EEG waves is essential in clinical and research settings as they offer a baseline to detect abnormalities or changes due to specific stimuli, conditions, or diseases.
Here’s a breakdown of the primary normal EEG waves, their definitions, and their significance:
Delta Waves
Definition: These are the slowest EEG waves, with a frequency of up to 4 Hz.
Significance: Delta waves are typically seen in deep, dreamless sleep, especially in infants and young children. Their presence in awake adults may suggest brain pathology.
Theta Waves
Definition: Theta waves have a frequency range of 4-8 Hz.
Significance: Commonly observed in children and drowsy adults, these waves are most prominent during deep meditation or when falling into a light sleep. Like delta waves, prominent theta activity during wakefulness in adults can be indicative of neurological issues.
Alpha Waves
Definition: These waves range between 8-13 Hz in frequency.
Significance:Alpha waves are usually present when a person is in a relaxed and calm state, but alert. They are most prominent when a person is daydreaming or passively letting their mind wander. A lack of these waves when a person is at rest might be an indicator of a brain disorder.
Beta Waves
Definition: These are faster waves with a frequency range of 13-30 Hz.
Significance:Beta waves are associated with active, analytical thought. They become more pronounced when a person is alert, attentive, or engaged in problem-solving, decision-making, or focused mental activity.
Gamma Waves
Definition: These are the fastest EEG waves, with frequencies above 30 Hz.
Significance:Gamma waves are associated with higher processing tasks, as well as cognitive functioning. They play a role in various functions like perception, consciousness, and memory recall.
How can EEG data be interpreted?
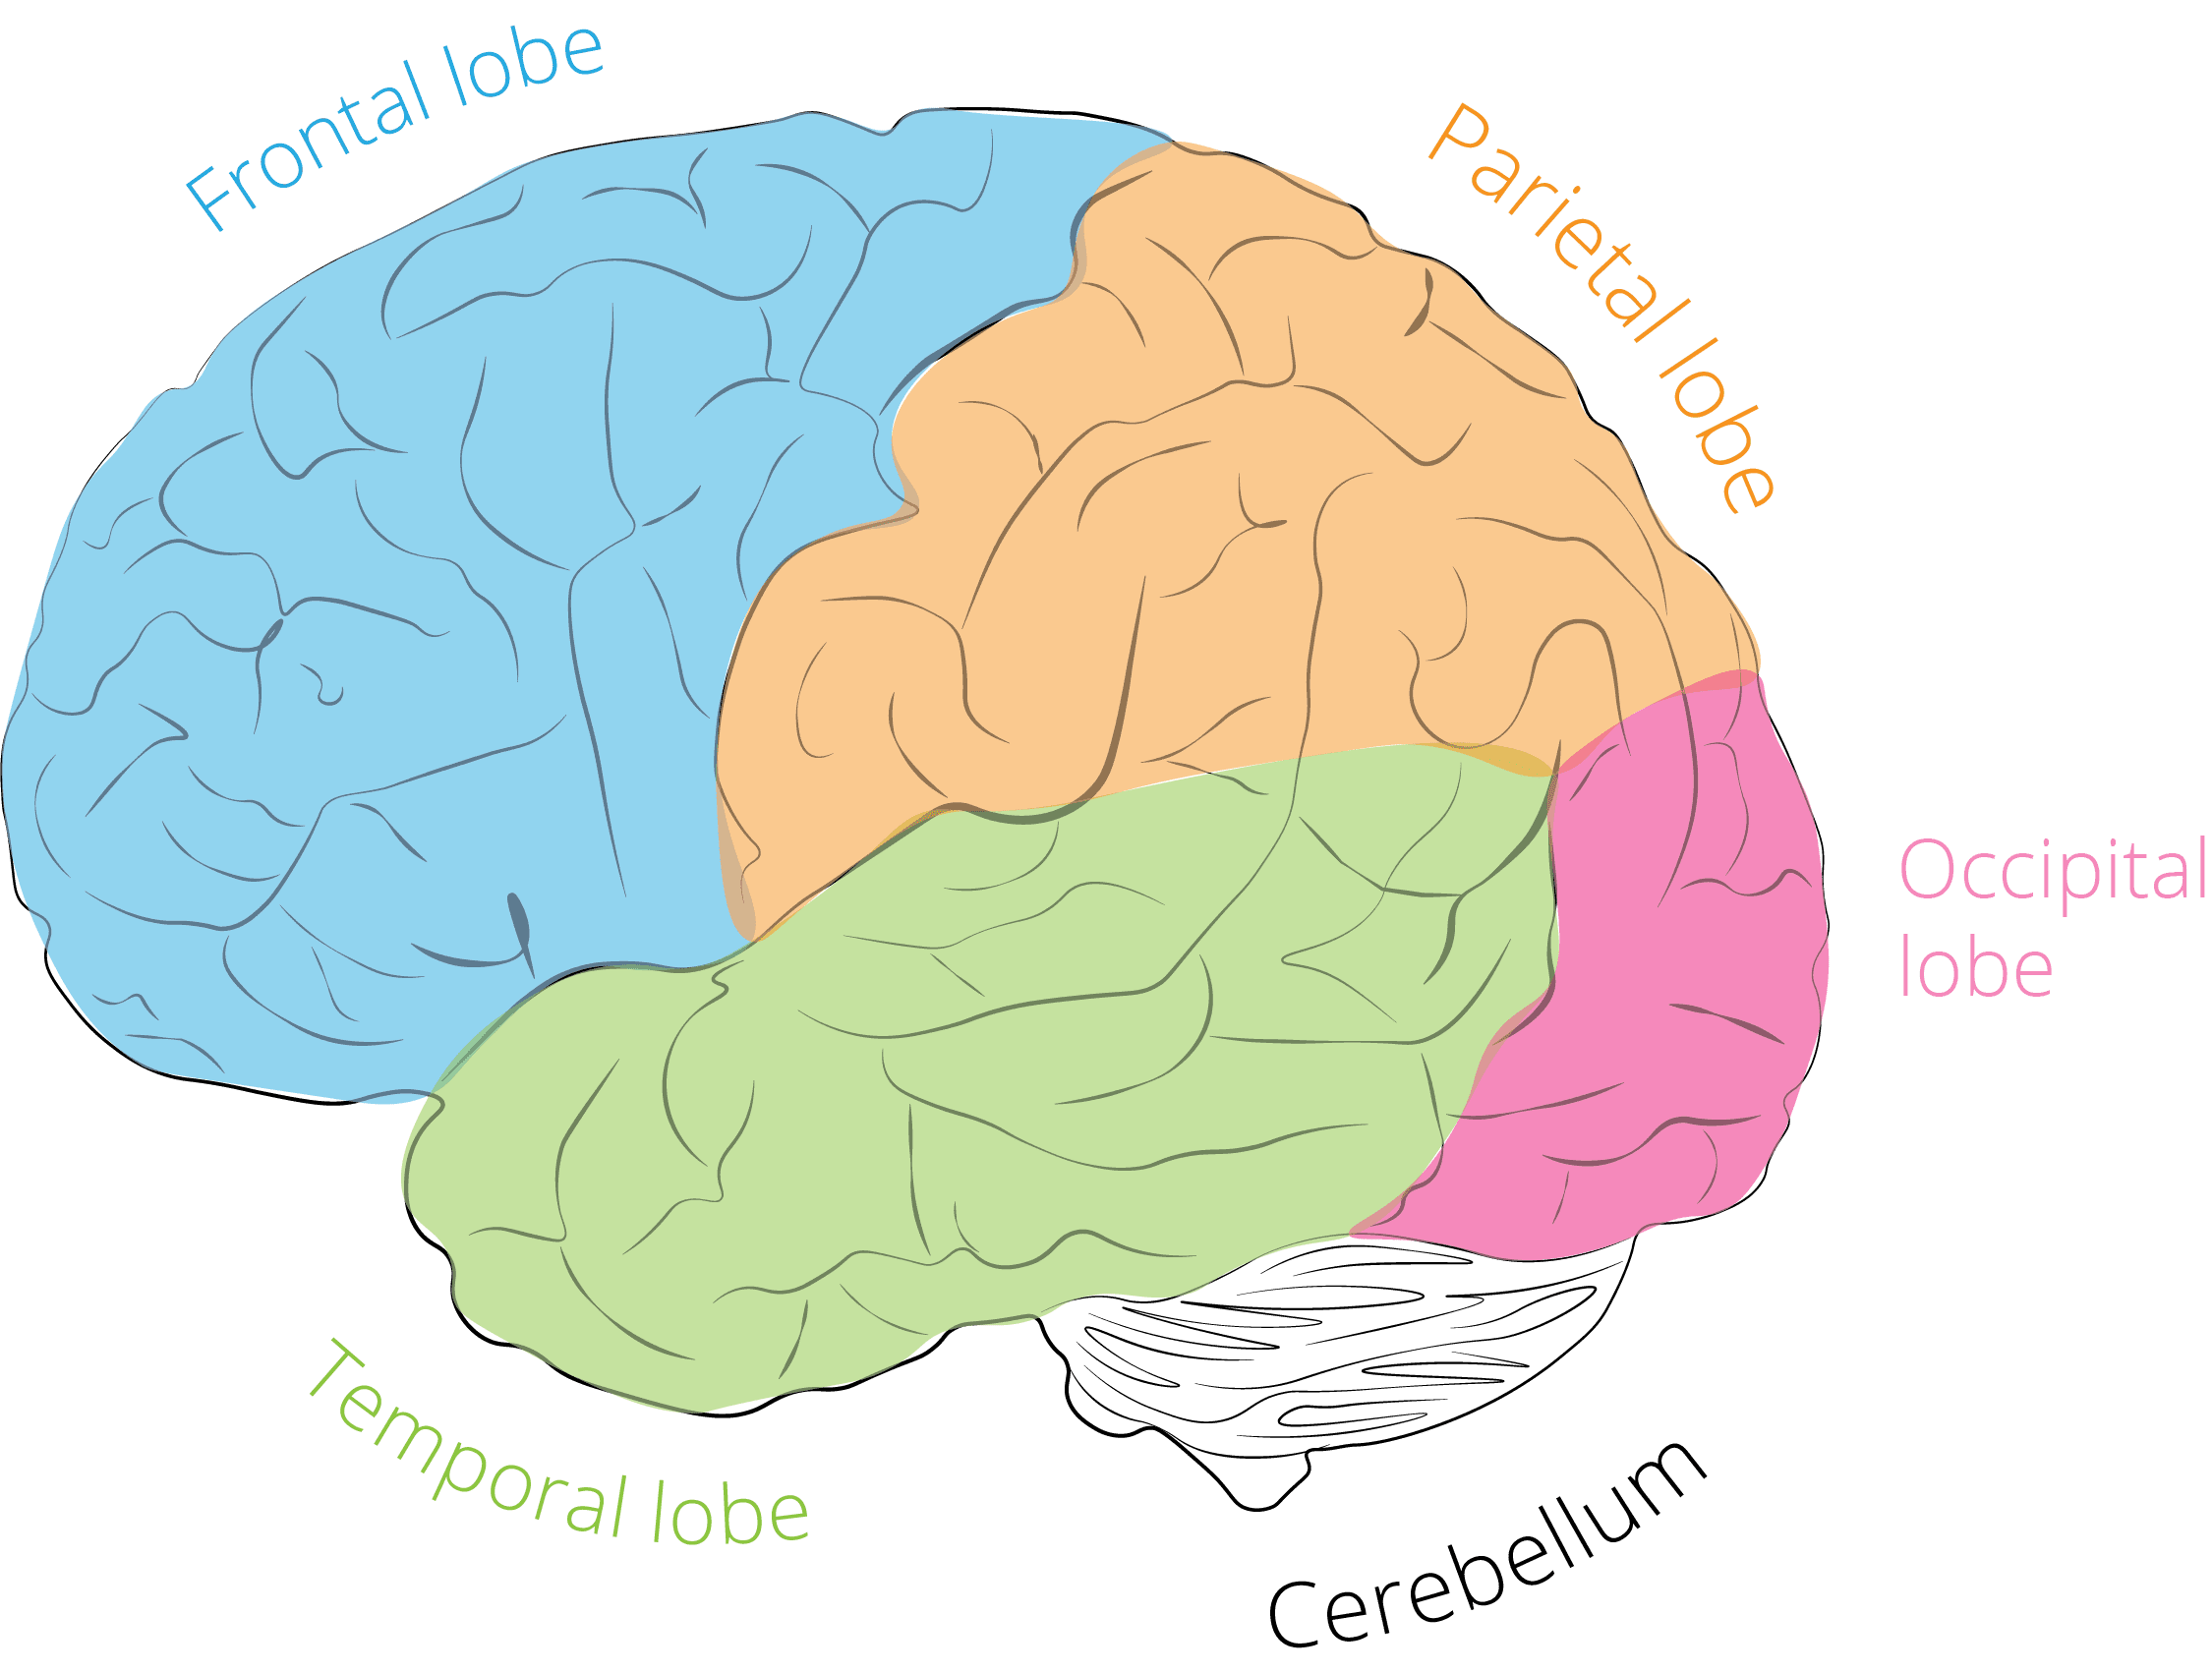
As EEG monitors the time course of electrical activity generated by the brain, you can interpret which areas of the cortex are responsible for processing information at a given time:
Areas of the brain and what they do
- Occipital cortex
The occipital cortex is the visual processing center of our brain, located in the rearmost portion of the skull. All the things that we see are processed here (although some processing does also occur before and after the signal arrives). EEG experiments with visual stimuli (videos, images) often focus on effects in occipital regions. - Parietal cortex
The parietal cortex is all about integrating information stemming from external sources and internal sensory feedback from our body. The parietal cortex is responsible for merging all of these information sources into a coherent representation of how our body relates to the environment, and how all things (objects, people) in the environment spatially relate to us. Tasks requiring eye or hand movements as well as eye-hand coordination would be impossible without parietal cortex, which also processes, stores and retrieves the shape, size and orientation of objects to be grasped. - Temporal cortex
The temporal cortex is associated with processing sensory input to derived, or higher, meanings using visual memories, language and emotional associations. The left temporal cortex is involved in the comprehension of written and spoken language. Medial (inner) regions are more active during spatial navigation. - Frontal cortex
The frontal part of the human brain is enlarged compared to most other mammals. Basically, the frontal cortex is all about executive function: it helps us maintain control, plan for the future, and monitor our behavior. Apart from the regional characteristics of where certain electrical activity originates, you can also analyze which frequencies primarily drive the ongoing activity.
The Neural oscillations that can be measured with EEG are even visible in raw unfiltered, unprocessed data. However, the signal is always a mixture of several underlying base frequencies, which are considered to reflect certain cognitive, affective, or attentional states. Whenever your brain is in a certain state, the frequency patterns change, giving insight into cognitive processes.
EEG Frequency ranges / Frequency Bands
Delta Waves (<4Hz)
- In sleep labs, delta waves are examined to assess the depth of sleep. The stronger the delta rhythm, the deeper the sleep. Increased delta power (an increased quantity of delta wave recordings) has also been found to be associated with increased concentration on internal working memory tasks [1].

Theta Waves (4 – 7 Hz)
- It is associated with a wide range of cognitive processing such as memory encoding and retrieval as well as cognitive workload [2]. Whenever we’re confronted with difficult tasks (counting backward from 100 in steps of 7, or when recalling the way home from work, for example), theta waves become more prominent. Theta is also associated with increased fatigue levels [3].
Alpha Waves (7 – 12 Hz)
- Whenever we close our eyes and bring ourselves into a calm state, alpha waves take over. Alpha levels are increased when in a state of relaxed wakefulness. Biofeedback training often uses alpha waves to monitor relaxation. They are also linked to inhibition and attention [4].
Beta Waves (12 – 30 Hz)
- Over motor regions, beta frequencies become stronger as we plan or execute movements of any body part [5]. Interestingly, this increase in beta is also noticeable as we observe bodily movements of other people [6]. Our brain seemingly mimics their limb movements, indicating that there is an intricate “mirror neuron system” in our brain which is potentially coordinated by beta frequencies.
Gamma Waves (>30 Hz, typically 40 Hz)
- Some researchers argue that gamma reflects attentive focusing and serves as carrier frequency to facilitate data exchange between brain regions [7]. Others associate gamma with rapid eye movements, so-called micro-saccades, which are considered integral parts for sensory processing and information uptake [8].
Analyzing EEG data can get quite challenging. Signal processing, artifact detection and attenuation, feature extraction, and computation of mental metrics such as workload, engagement, drowsiness, or alertness all require a certain level of expertise and experience to properly identify and extract valuable information from the collected data.
The iMotions EEG module offers several tools and capabilities for you to get up and running with EEG research quickly, and is able to carry out some of this data processing automatically. Below we will go through the ways in which the EEG module can help advance research.
EEG data and analysis
EEG data analysis can admittedly be a complex process, which is why iMotions has several features designed to reduce the burden of this step.
Frontal alpha asymmetry, a measure used as a proxy for feelings of approach or avoidance, is typically used to provide an assessment of how appealing or repellent a stimulus is. This and power spectral density (PSD) can be automatically calculated in iMotions, and the R code used to build the analysis is fully available and transparent.
Other manufacturers, such as ABM may also provide the capability to calculate proprietary metrics – such as levels of drowsiness or engagement. These metrics are also provided within the iMotions software, giving you easy access to detailed insights.
There may also be parts of the analysis which you want to exclude, or look at in more detail. iMotions provides an annotation tool that can be used either live as data-collection occurs, or following data collection. It’s straightforward to mark up the data and select specific segments for processing or export.
The data, whether raw, processed, or segmented can of course also be exported in easily transferable formats, allowing you to take your analysis to whichever platform you prefer. There is also information about computer use, such as mouse clicks and keystrokes, particularly useful when relating stimulus interaction to biosensor data.
EEG integrations
iMotions allows native integrations with several different EEG headsets from four leading EEG hardware companies. Whether you want to gather data from high sampling rate 32-channel devices, flexible and wireless 24 channel devices, or measure frontal asymmetry with an 8 channel headband, iMotions provides straightforward solutions for each.
iMotions also provides the possibility to connect multiple, different biosensors together in order to create a deeper analysis of human behavior. Biosensors such as eye trackers (screen-based, glasses, or virtual reality), facial expression analysis, EDA, ECG, and EMG (among others) can be readily included in any experiment.
Check out: The Study of Human Behavior: Measuring, analyzing and understanding [Cheat Sheets]
The data from these sensors is complementary – each provides novel information about the participant’s emotional expressions, physiological arousal, or visual attention, which is not available when considering EEG alone.
It’s also possible to connect a variety of other sensors that aren’t natively integrated by using the Lab Streaming Layer (LSL) protocol. This allows data from other sensors to be sent in to iMotions and synchronized with other data sources. This is complemented by the possibility to use the open API to connect essentially any other data stream. Virtually any data-producing device can be connected into iMotions, creating new research possibilities.
EEG Prices
As with many devices (and most things in life): you get what you pay for. Many of the devices at the upper ends of the pricing range are particularly advanced, research-grade devices that provide incredible sensitivity, with a large number of sensors too. Part of the trade-off is that it takes longer to collect and analyze the data, but whatever your need are – it’s always good to talk to the experts first.
This is why we have set out the range of prices you are likely to find when searching for the EEG headset that is perfectly suited to your needs. The specific prices can be hard to pin down, as some are not public, or can be subject to academic discounts, and can fluctuate with changing currency prices, amongst other reasons.
Making a choice between devices is of course best done with an expert at hand, and we are always available if you want to discuss your needs. Below you will find the price range of headsets from some of the leading manufacturers.
Check out: EEG Headset Prices – An Overview of 15+ EEG Devices

Browse full range of EEG headsets
- EEG headsets from Neuroelectrics, ABM and Brain Products
- Get technical support and guidance in choosing the right equipment
- Full compatibility with iMotions for multimodal research
EEG and stimulus presentation
Experiments are rarely alike, and this is reflected in the diversity of stimuli types. iMotions allows, in a single platform, virtually any form of stimulus to be presented – whether it’s images, video, audio, games, webpages, virtual reality (VR), mobile devices, or out in the real world (although there are aspects to consider if using EEG in dynamic environments). The EEG devices are automatically synchronized with the stimuli, and any other devices that might be connected – allowing you to let iMotions run the experiment for you.
Complete experimental platform
iMotions is a complete behavioral lab in one software – from experiment design, device integration and synchronization, to stimuli presentation, data collection, processing, and export. Depending on your needs iMotions also offers several analysis capabilities that can help expedite the experimental process. This means there is no need for a complex and costly patchwork setup of software – the entire experiment can be controlled and carried out in iMotions.
Free 59-page EEG Guide
For Beginners and Intermediates
- Get a thorough understanding of the essentials
- Valuable EEG research insight
- Learn how to take your research to the next level

How to cite the article:
Bryn Farnsworth, What is EEG (Electroencephalography) and How Does it Work?, (DATE ACCESSED), [online] Available: https://imotions.com/blog/learning/research-fundamentals/what-is-eeg/
References
[1] Harmony, T. (2013). The functional significance of delta oscillations in cognitive processing. Frontiers in Integrative Neuroscience.7:83 10.3389/fnint.2013.00083
[2] Klimesch, W. (1999). EEG alpha and theta oscillations reflect cognitive and memory performance: a review and analysis. Brain Res. Rev., 29 (2-3), 169–195
[3] Craig, A., Tran, Y., Wijesuriya, N., Nguyen, H. (2012). Regional brain wave activity changes associated with fatigue. Psychophysiology 49:574–582
[4] Klimesch, W. (2012). Alpha-band oscilaltions, attention, and controlled access to stored information. Trends Cogn Sci.16(12):606–17. 10.1016/j.tics.2012.10.007
[5] Takahashi, K., Saleh, M., Penn, R. D., Hatsopoulos, N. G. (2011). Propagating waves in human motor cortex. Front Hum Neurosci. 5(40):40
[6] Halder, S., Agorastos, D., Veit, R., Hammer, E. M., Lee, S., Varkuti, B., et al. (2011). Neural mechanisms of brain-computer interface control. Neuroimage 55, 1779–1790. Doi: 10.1016/j.neuroimage.2011.01.021
[7] Jia, X., Kohn, A. (2011). Gamma Rhythms in the Brain. PLOS Biology. 9(4):e1001045 doi: 10.1371/journal.pbio.1001045
[8] Yuval-Greenberg, S., Tomer, O., Keren, A. S., Nelken, I., Deouell, L. Y. (2008). Transient induced gamma-band response in EEG as a manifestation of miniature saccades. Neuron. 58: 429–41. doi: 10.1016/j.neuron.2008.03.027