A central feature of the iMotions software suite is its ability to visualize data coming from the broad range of hardware components our clients choose to employ in their research. Without the help of R Notebooks, the signal coming from the hardware would be very difficult and time-consuming to decipher and analyze. The name “R Notebook” is a bit of a vague name to give to such an integral component, so in this blog, we provide an explanation of what it is and what it does:
Table of Contents
How to visualize data with R Notebooks
The concept behind R Notebooks, in essence, is that they are custom-programmed scripts that can process signals coming from the hardware you use to conduct your biometric research and turn them into interpretable data representations. That data are the presentable and publishable visualizations you see in the iMotions software platform. Instead of seeing strings of large datasets, which represent the raw sensor signals, with the help of R Notebooks, you can see, adjust, and export graphs and decipherable metrics according to your study parameters.
“R” (in R Notebook) is a programming language that is an implementation of the programming language “S”. Where S is a statistical computing language, “R” was created to allow for visualization and data modeling. Our R Notebooks are programmed especially for our specific platform, which is why our customers and clients can access reports and visualizations that are not otherwise available on the market.
Since we launched iMotions Software v.8.0 we have used R Notebooks for our signal processing algorithms. Before we made the R Notebooks integral to our software, all signal processing was hardcoded, thus making it far more rigid than it is now.
Our aim with implementing the R-Notebooks into our software is twofold. Firstly, the guiding philosophy at iMotions has always been to make data collection and analysis as smooth of an experience as possible while still staying flexible for our diverse clients.
Secondly, we appreciate that our customers very often need to present their findings and conclusions to people who have not been part of the data collection process. Therefore they rely on accurate visual representations and easy-to-understand metrics to communicate their findings.
What Biometric data can be visualized in iMotions Software Platform
Our R Notebooks cover all our available modules and visualize the most popular metrics our users employ on a daily basis in their research. We are constantly updating our R Notebook offerings, with several new ones planned for 2022. See some highlighted R Notebooks below, or find the complete list on the iMotions Help Center.
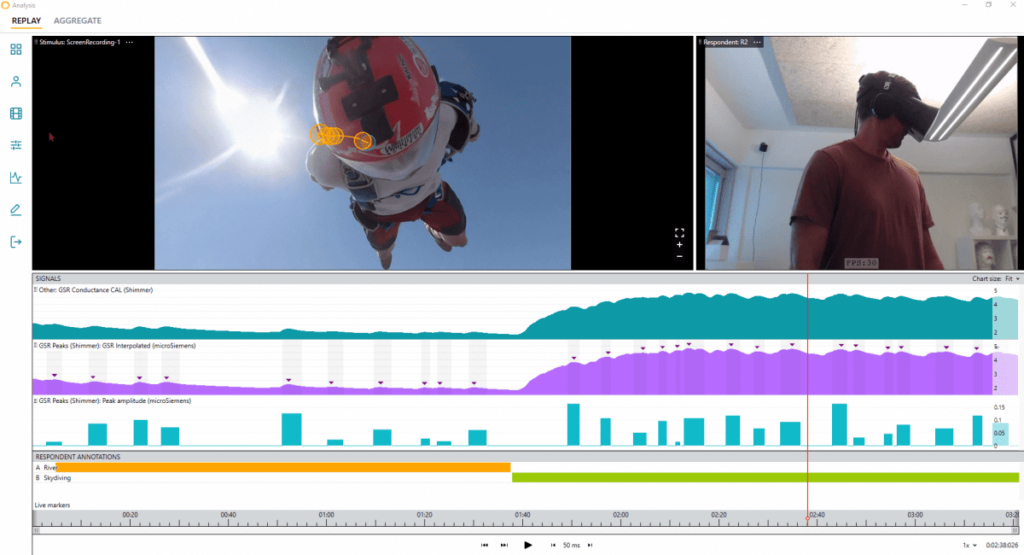
Galvanic Skin Response (GSR):

Learn more about: What Is EDA Peak Detection and How Does It Work?
Analysis for Galvanic Skin Response (GSR): Peak Detection, Peak Binned Aggregation, Signal Quality, and Epoching.
Highlighted feature: GSR Binning (Epoching) – Researchers now have the opportunity to choose to analyze GSR by events or by time. This notebook goes from raw signal to testable and publishable data without the need for signal processing experience. Eliminates the difficult question of “what threshold do I need for peak detection?”
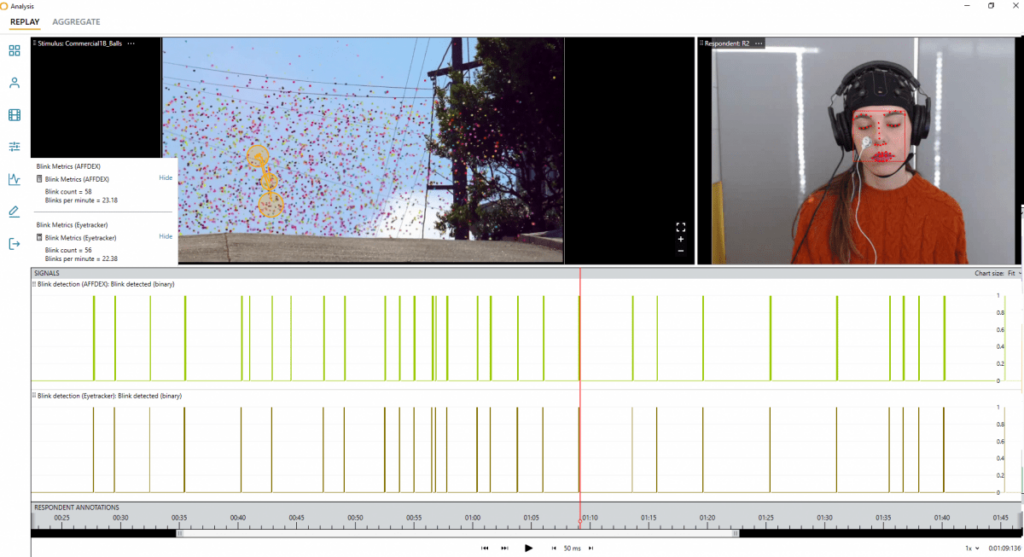
Facial Expression Analysis (FEA):
Analysis for Facial Expression Analysis (FEA): AFFDEX Thresholding and Aggregation, AFFDEX Blink Detection, RealEyes Thresholding & Aggregation.
Highlighted feature: iMotions facial expression modularity allows you to record and post-process multiple faces for analysis. Our newest addition, the capability to conduct data collection remotely, allows you to scale the study to a larger pool of respondents.
Learn more: Everything you can do with the Facial Expression Analysis (FEA) module in iMotions
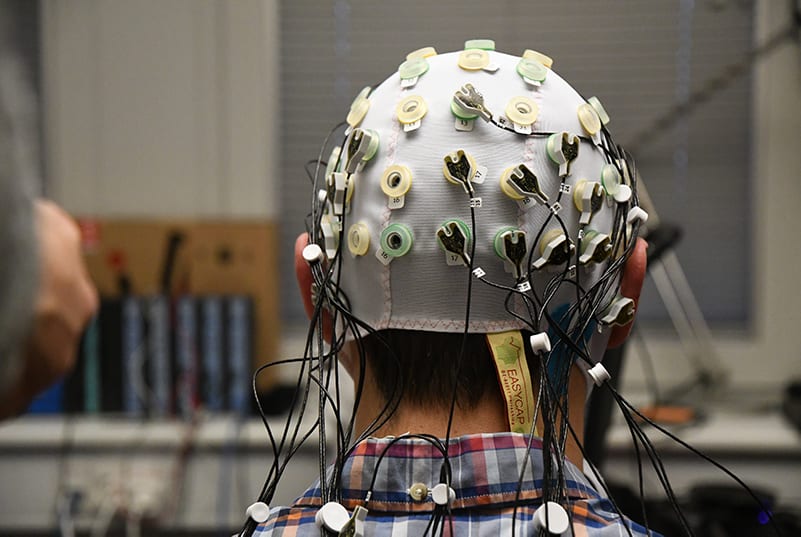
Electro-encephalography (EEG):
Learn more: What is EEG (Electroencephalography) and How Does it Work?
Analysis for Electro-encephalography (EEG): Power Spectral Density, Frontal Asymmetry, Frontal Asymmetry Aggregation.
Highlighted feature: The Frontal Alpha Asymmetry (FAA) R Notebook runs a complete signal processing protocol for obtaining FAA scores. This is an EEG-based metric of ‘approach and withdrawal related motivation’, or equivalently, ‘liking and disliking’. In the FAA Notebook we have also added a way for you to compute mental workload.
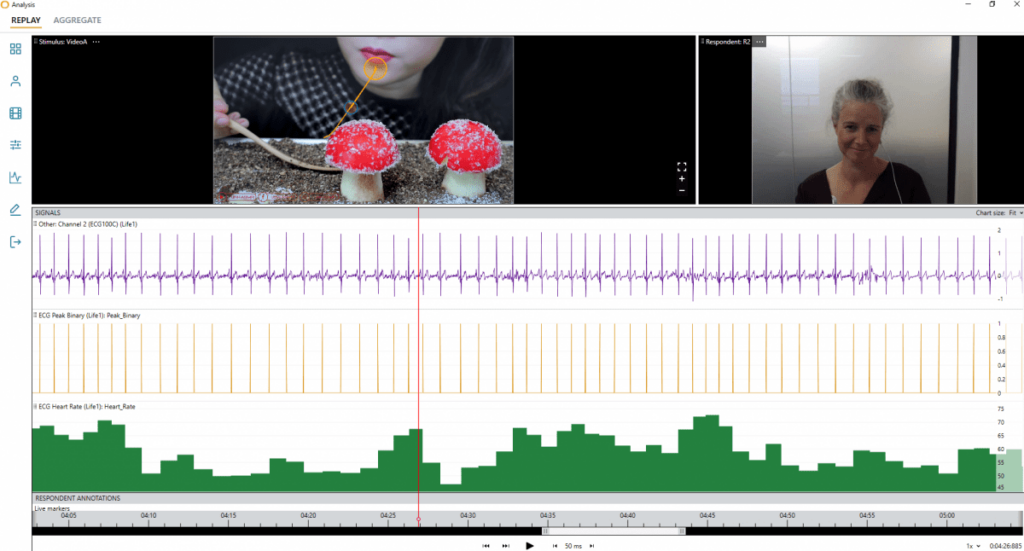
Electrocardiography (ECG):
Analysis for Electrocardiography (ECG): Heart Rate & Heart Rate Variability.
Highlighted feature: How HRV is calculated is where things can get tricky. Methods work in different ways, and the results from each might not be directly comparable – getting it right is therefore critical for your work or research. The HR & HRV Notebook computes the single respondent peak detection and calculations of HR and HRV during each stimulus, giving you data points associated with emotional regulation, social skills, and cognitive processes.
Learn more: Heart Rate Variability – How to Analyze ECG Data
Electromyography (EMG):
Analysis for Electromyography (EMG): Smoothing & Normalization.
Highlighted feature: The R Notebook allows for the normalization of a smoothed signal to a maximum voluntary contraction stimulus, for comparing EMG activity across people or conditions.
Read more: What Is EMG (Electromyography) and How Does It Work?
Eye Tracking:
Analysis for Eye Tracking: Blink Detection
Highlighted feature: The blink detection algorithm in the R Notebook first tags all instances of ‘missing values’ where there is no eye tracking data as blinks. Then, the algorithm only considers instances with consistent ‘missing values’ in both the left and right eye. Hereafter, the algorithms re-evaluates the tagged blinks, retaining only the tags that likely represent actual blinks.
Read about how Blink detection can help with take-over performance of Autonomous Vehicles
If you are already an iMotions customer and want to have more in-depth knowledge on how our range of R-Notebooks work, please visit our Help Center (login required).
As a concluding remark, it should be said that, as is shown above, we have custom-coded all of our R Notebooks for use in the iMotions Software. They each fulfill specific tasks and process specific metrics. However, if you need to process different metrics it is entirely possible to edit our R Notebooks to fit the scope of your study or research. We strongly advise against editing our R Notebooks unless you are familiar with coding in R already, as it may lower your experience with the iMotions platform.
If you think that your research could benefit from the visualization opportunities that iMotions can help you create with our R-Notebooks, please contact us for a free consultation or a free online demonstration of what you can expect from our R Notebooks as well as our iMotions Software Platform.