Discover the transformative power of empathetic gazes through emotional heatmaps in iMotions. This introduction explores how these innovative tools enhance understanding of human emotions, enabling deeper insights and improved interactions in various settings. Unlock the potential today.
Table of Contents
You know heatmaps – but what are emotional heatmaps?
If you have found your way to this site, you are most likely already familiar with heatmaps generated from eye tracking data. This visualization summarizes which part of your visual stimuli drew the most attention, or which part got completely overlooked. Traditionally, heatmaps have been generated purely from eye tracking data, but that is changing now. The latest feature in the iMotions software is the ability to create what we call “emotional heatmaps”. By combining eye tracking with facial expression analysis, it is now possible to create heatmaps showing what emotions a respondent was displaying when looking at different areas of an image.
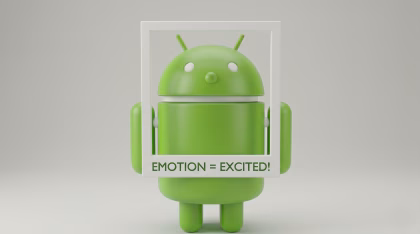
Let us say that you have made a visual campaign that has several layers of information/messaging in one image, and you would like to know if people are smiling when they look at what you designed them to smile at – that is now possible and easy to achieve. The “emotional heatmap” feature is only a few buttons away in the analysis tool. You can generate, visualize and export both eye tracking heatmaps and emotional heatmaps within the iMotions software suite.
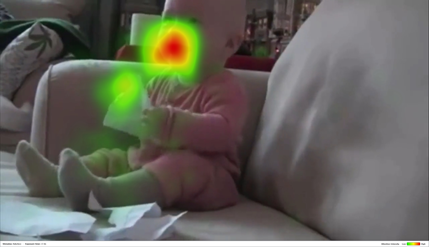
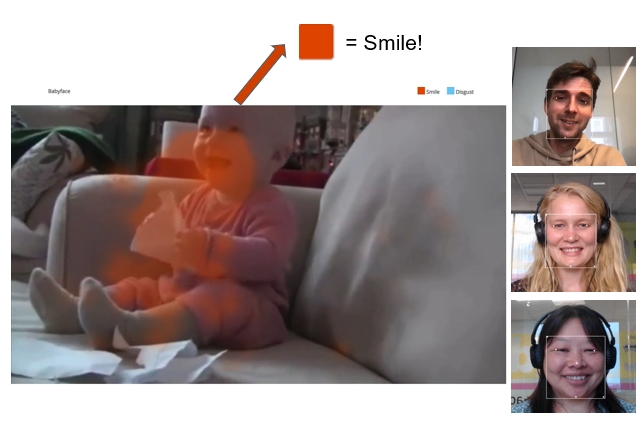
Here you can see how an eye tracking heatmap Vs. an emotional heatmap both differ, yet are essentially the same concept but with different data input.
What are the values of emotional heatmaps?
Using emotional heatmaps, researchers are able to tell not just what people are looking at on a screen but also what emotions they are displaying as they watch content like printed Ads, product packages, website pages, etc.
Eye tracking data reveals which parts of an image or video catch our attention while emotions play a crucial role in driving effective communication and advertising. It has been reported that there are positive correlations between viewers’ experienced emotional intensity to an Ad, and their subsequent willingness to pay for the advertised product. (Unruly ShareRank data; Feb 2013 to March 2015; n=84,000) (https://contently.com/2013/12/16/the-emotions-that-trigger-video-sharing/)).
Combining the emotional (facial expressions) and the visual (eye tracking) attention components into your research with iMotions in an innovative way, to provide you with more in-depth and meaningful findings.
Where can emotional heatmaps provide value?
Emotional heatmaps are ideal for research with advertisements, communications, or UX. It is particularly well-suited to static content with brands, or elements of interest that you want to capture gaze and emotional responses for, whether from a communication, navigation, or design standpoint.
Image-based content testing
Image-based content covers a lot of different areas of content. Advertisements, reading and learning materials, and even architecture to name a few can all be measured and analyzed with eye tracking heatmaps. As with eye tracking heatmaps, emotional heatmaps provide evidence of how people are emotionally expressing themselves in response to the same content.
Through visualizing viewers’ emotional engagement with image-based content it is possible to determine which elements catch the interest of viewers and whether that interest is positive or negative. Below is a promotional image from a famous car manufacturer where it shows how the branding elements can be observed to see how many positive emotions it elicits and its interactions with other surrounding elements through an emotional heatmap.

Here is an example of an emotional heatmap gauging the “positive and negative valences in participants. (example from iMotions internal study)
Learn more about how to start your Ad testing, package testing with iMotions here!
Website UX Design
Emotional heatmaps can help determine the impact of user interfaces on user preference, task completion, and more. AB testing can provide nuanced insight for emotional expressions in response to website design. For example, it’s possible to see if participants furrow their brows when reading the T&C on the page, or how their expressions change as they click through the navigation bar. This can help understand elements that are visually pleasing, confusing, frustrating, or engaging for users.
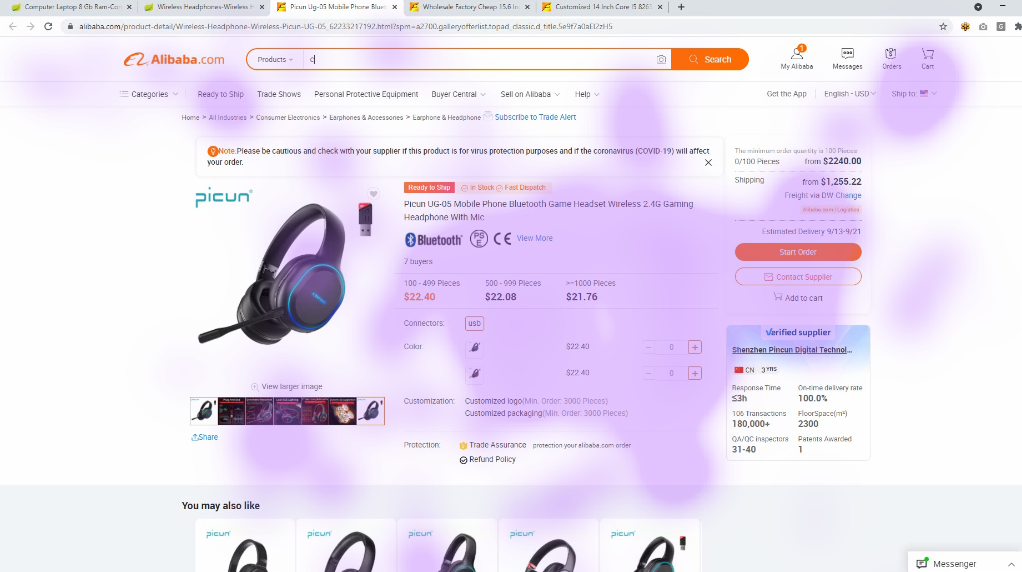
An example of a respondent’s journey through a webpage, while tracking “brow furrows”. (example from iMotions internal study)
Learn more about how to start your Web UX study with iMotions here!
Emotional Heatmap only adds to the iMotions analysis toolkit one additional powerful tool for your Multimodality Research. When combined with other analysis tools in iMotions, one can even gain more insights into the fascinating human behaviour research world, both qualitatively and quantitatively.
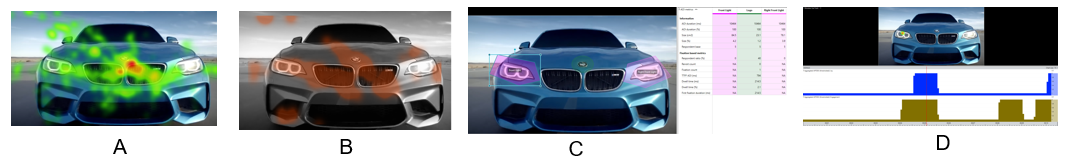
A: eye tracking Heatmap, B: emotional heatmap, C: AOI editor, D: Aggregate Replay window