This article provides a comprehensive overview of analyzing ECG data through the lens of heart rate variability. It elucidates key methodologies and considerations essential for accurate interpretation. An indispensable read for those seeking a deeper understanding of ECG analysis.
Table of Contents
Our heart is a central part of our lives in many ways – we might have a heart-to-heart talk, put our hand to our heart, have a heart of gold, or a change of heart. While it’s clear that this blood-pumping organ is important for the way in which we talk about the world, it is of course also central to our physiology.
It is of course an understatement to say that the heart is critical for our well-being. But while we may often think of our hearts in relation to our health, there is also much more to these beats that can tell a deeper story of who we are.
There has in recent times been an increased use of ECG devices (electrocardiogram – also known as EKG, all of which are the same thing) and a proliferation of advanced techniques that offer the tantalizing possibility of new discoveries once applied to new data.
While largely motivated by medical concerns, ECG is being used more and more by researchers and investigators seeking to gain a better understanding of physiological arousal (often as an adjunct to other biosensor methods). As the heart rate is coupled to autonomic nervous system activity, it provides a suitable proxy for examining how we feel.

Of course, simply recording the heart rate isn’t enough to learn something new about how we feel. The best insights are obtained through analysis of the data. Fortunately for researchers, there are many ways to go about this – unfortunately though, there are many, many ways.
Read more: What Is ECG and How Does It Work?
That’s why we’ve put together this explanation of a few of the most common (and not so common) techniques for making the most of heart rate data, and for gaining a deep understanding of how arousal is intertwined with our experiences.
- Heart Rate Variability (HRV)
- What can Heart Rate Variability tell you?
- How to Calculate and Analyze Heart Rate Variability (3 Methods)
- Analysis and Conclusion
- Download ECG Guide
Heart Rate Variability (HRV)
One of the first things to know when understanding heart rate is that the most informative metric relies not just on the heart rate, but how much the heart rate varies. What’s often at first glance counter-intuitive about this metric is that a higher heart rate variability (HRV) is associated with good health – the more your heart jumps around (to an extent, of course), the readier you are for action. On the other hand, a low HRV is associated with ill health – it is a significant predictor of mortality from several diseases.
What can Heart Rate Variability tell you?
While the medical uses of HRV are widely used, there are also aspects of thoughts, emotions, and behaviors that can be derived from HRV data.
Read Blog: Heart Rate Variability – What This Measure Means for Emotions
From psychology studies, we know that HRV is associated with many factors. Researchers have found that an increase in HRV is related to increased self-control abilities, greater social skills, and better abilities to cope with stress, among other findings. The applications are therefore clearly more broad than directly medical situations.
Overall HRV can be said to be an indicator of physiological stress or arousal, with increased arousal associated with a low HRV, and a decreased arousal associated with high HRV. Using ECG alongside other measurements therefore provides another way to investigate how people respond to different settings or stimuli.
How to Calculate and Analyze Heart Rate Variability (3 Methods)
How HRV is calculated though is where things can get tricky. Methods work in different ways, and the results from each might not be directly comparable – getting it right is therefore critical for your work or research.
Before we get there though, there are some things to know about the way the monitored ECG signal appears. The image below shows a prototypical heartbeat.
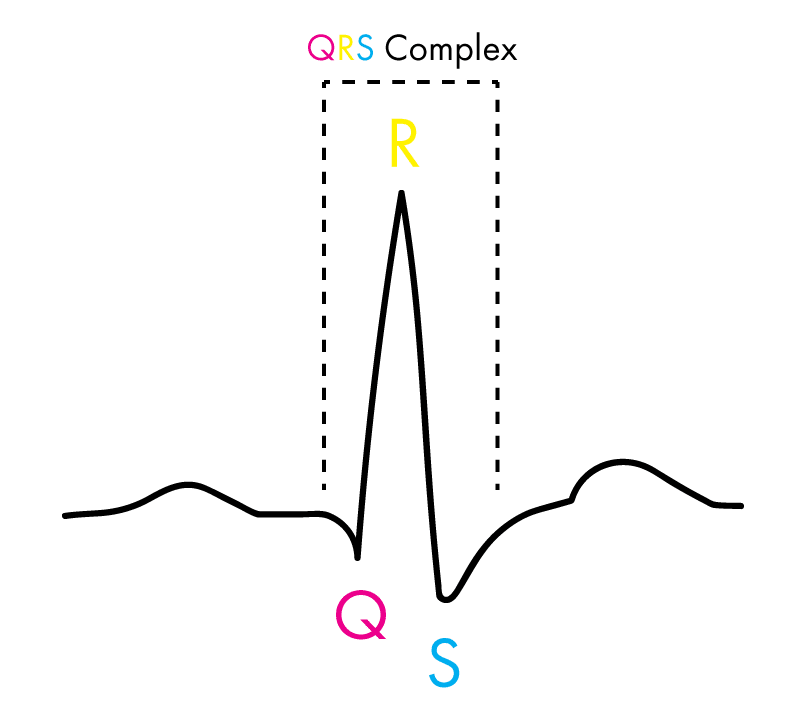
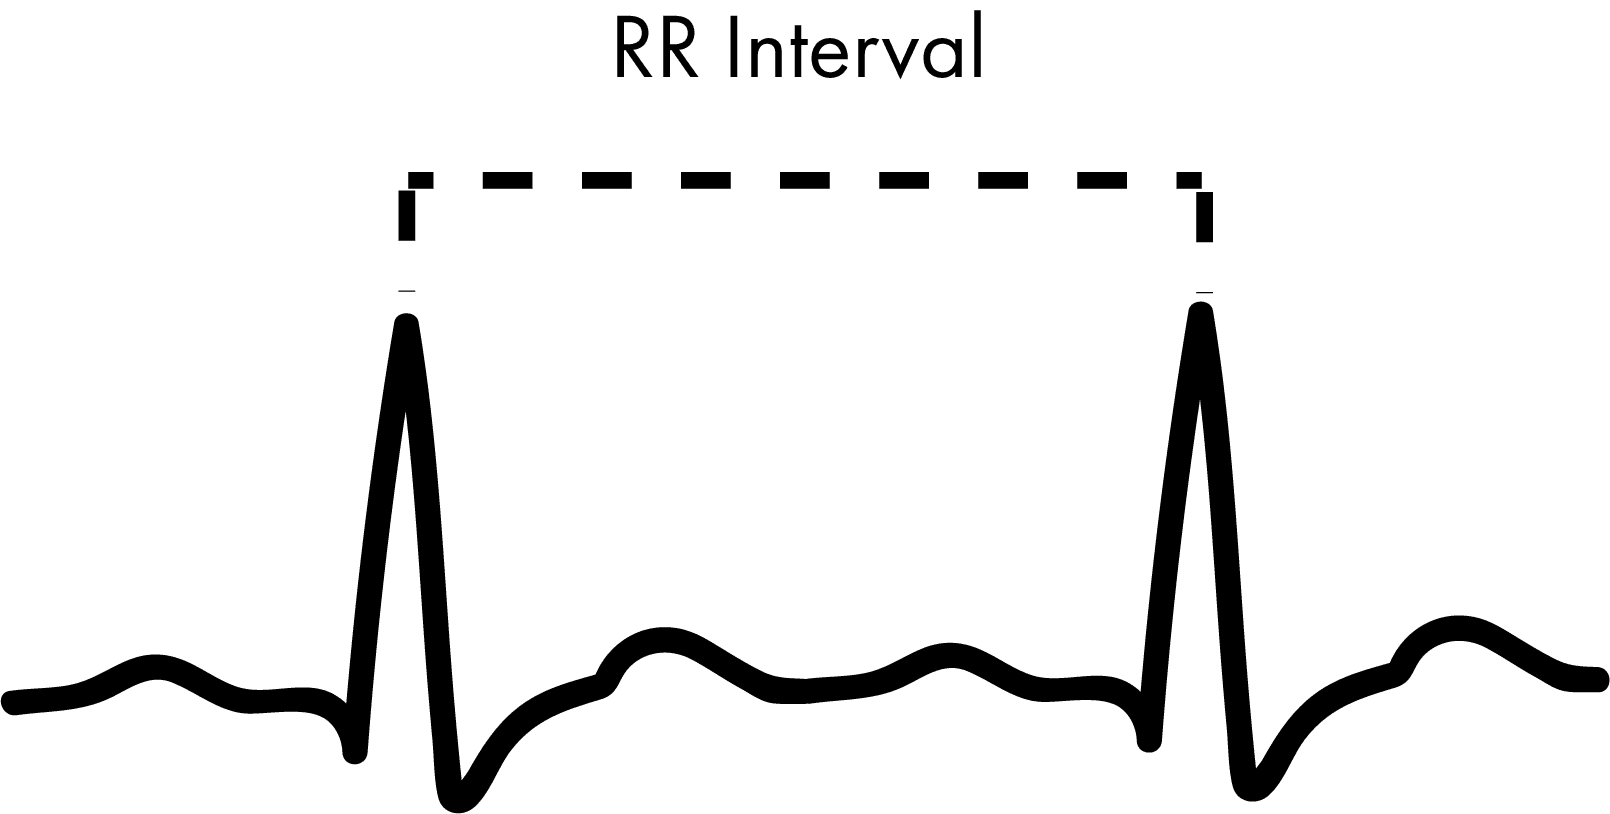
This is known as the QRS complex, with each letter corresponding to a different part of the heart’s action. The important thing to note is that the “R” of the complex is the area from which the values for analysis are taken. When we have several heartbeats next to each other, then the distance (in milliseconds) between each “R” is defined as the “RR interval” (or sometimes the “NN interval” to emphasize that the heartbeats are normal).
One of the main divisions for the way in which HRV is calculated is by either using time or frequency. In this context, time-domain methods mean that the beat-to-beat amount within an amount of time is used, while frequency-domain methods count the amount of low and high frequency beats that occur. This is explained further in the image below.
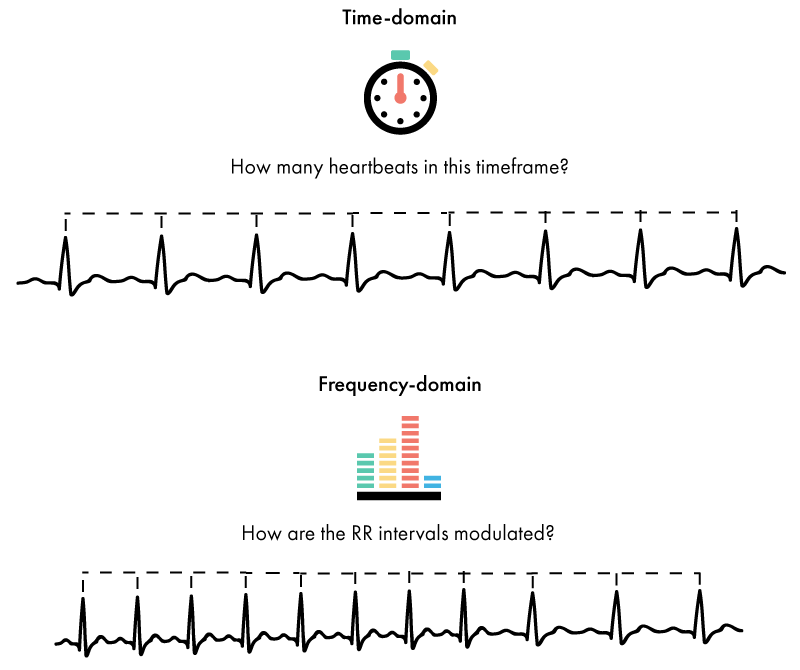
The extent to which the heart rate changes within a set amount of time, or the extent to which it is spread over different frequencies, will determine the amount of HRV.
There are also other ways in which to analyse the heart rate data, including geometric and non-linear methods. These methods offer new ways of examining the data, yet are not currently as widely employed.
Time-Domain Methods
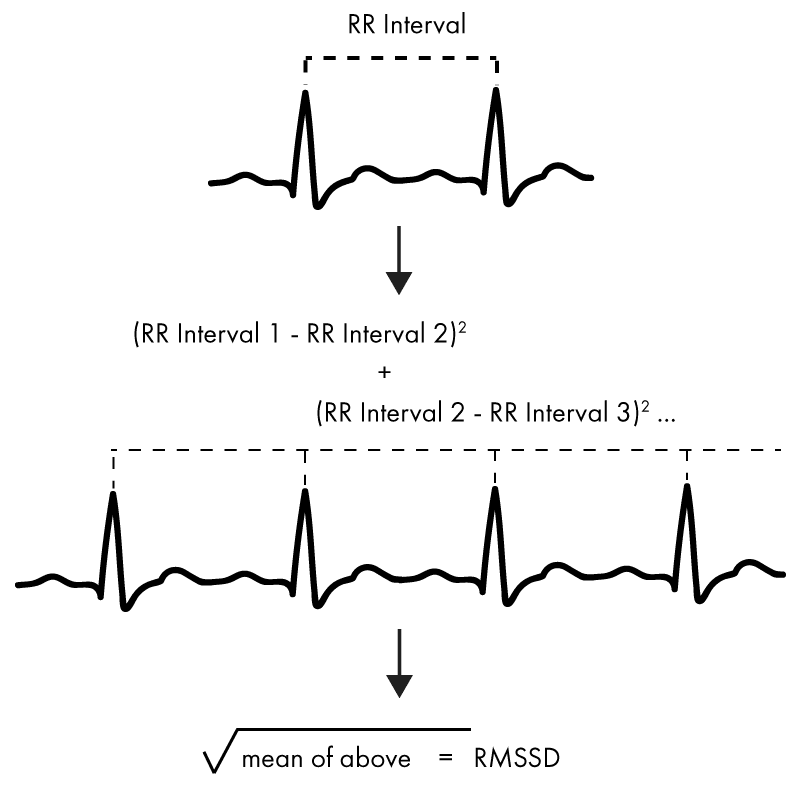
The single most common way in which to analyse HRV is a time-domain method called RMSSD. This is the Root Mean Square of Successive Differences between each heartbeat. It is relatively simple to calculate (important for large-scale computation), and provides a reliable measure of HRV and parasympathetic activity. How to calculate it is shown in the image below.
Two of the other most common time-domain methods used to calculate HRV are called SDNN, and SDANN. SDNN is calculated as the standard deviation of all of the RR intervals (the distance between each heartbeat, or the “R” of the QRS complex). The SDANN is similar, but requires that you first take the average RR interval from several 5 minute sections of a recording, and then the standard deviation.
Frequency-Domain Methods
Of the frequency-domain methods, data related to the amount of low frequency (LF) heartbeats is often used (0.04 to 0.15 Hz) as a measure of sympathetic nervous system activity. Measurements of high-frequency (HF; 0.15 Hz to 0.4 Hz) and very-low-frequency (VLF) are also used. The frequency is not concerned with heart rate per se, but the modulation of HRV.
In addition a ratio of HF and LF (HF/LF) can be determined to give information regarding the amount of sympathetic nervous system activity, but the strength of this has been debated. It is important to note that the Hz values don’t strictly refer to the number of heartbeats, but to the rate of recurrence of heartbeat rates.
Poincare Plots
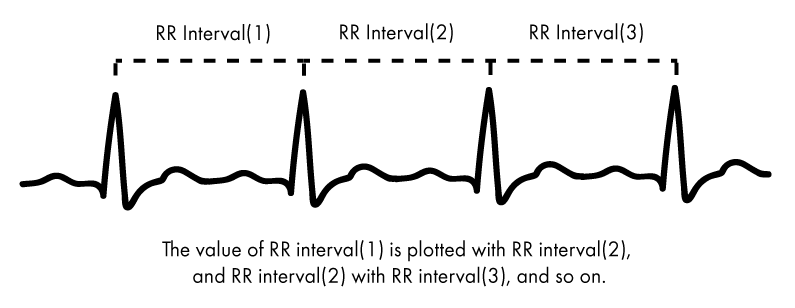
One of the most common visualization methods of HRV is a graph called a Poincaré plot. Named after the illustrious French mathematician, the graph plots the RR intervals (the distance between each heartbeat), with the RR interval just prior. This is explained further below.
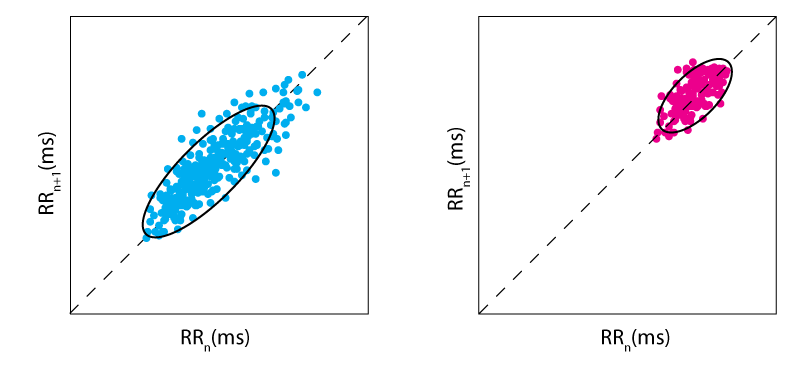
The Poincaré plot therefore shows how well each RR interval predicts the next – a greater spread of values would mean an increased HRV, while the closer they bunch together, the less HRV there is. Two examples of Poincaré plots are shown below – the left shows a high heart rate variability, while the right shows a limited heart rate variability.
By using Poincaré plots and other sophisticated analytical techniques, it’s possible to further numerically quantify the HRV of respondents.
Analysis and Conclusion
While the methods above are varied in both their calculation and execution, the story they tell is essentially the same – a quantification of HRV. The results from each method and test can inform findings that relate to not only our well-being, but also our psychological state too.
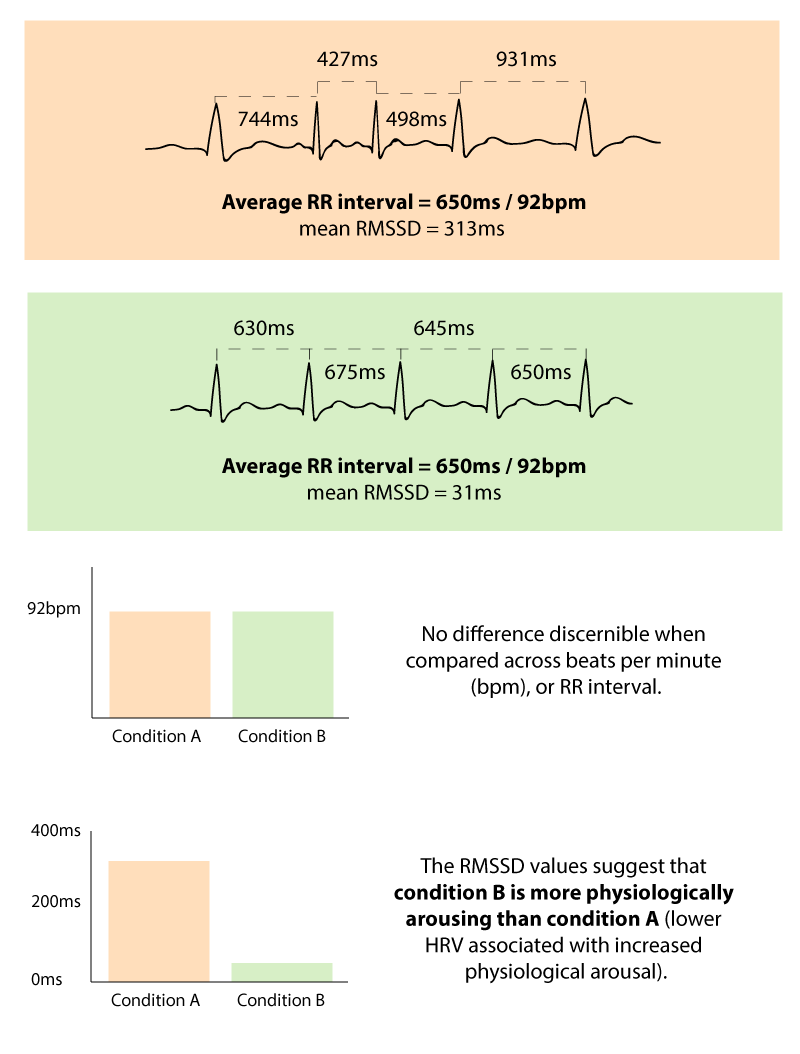
Although there are no standard accepted values that can be used to compare HRV results, it is possible to look at how the results of respondents compare to each other. This measurement also provides a more suitable comparison than using beats per minute (bpm). An example of how this could look is shown in the image below.
Using ECG with other biosensor measurements can provide a more complete way of understanding someone’s thoughts, emotions, or behaviors. By using the complementarity of each sensor to understand a different aspect of human responses (e.g. by pairing facial expression analysis with ECG to understand both emotion and arousal) it’s possible to gain a clear picture of how someone experiences the world.
With iMotions, it’s straightforward to begin research with a collection of sensors. Once ECG data is collected it can be readily transformed to a format suitable for Kubios, making the steps to advanced analysis even easier.
Among researchers, Kubios is one of most commonly used analysis tool for HRV. It offers a user friendly interface with options to correct signal artifacts as well as detailed reporting and analysis tool in both the time and frequency domain.
I hope you’ve enjoyed reading about the ways in which HRV can be calculated, and how it can inform and expand findings in your research.
Want to learn how iMotions can help with your ECG research?
We are happy to help with guiding you through choosing the right equipment and setup for your research. We also assist with training if needed. Contact us today for free unbiased consultation.