
Discover how voice analysis reveals emotional states, cognition and health by measuring vocal features like pitch, loudness, speaking rate and intonation, derived from vocal fold vibrations and resonances, and mapped into prosody, emotional dimensions and emotion categories. These enable research in clinical, behavioral, marketing and multimodal studies often combined with physiological signals like EDA for deeper human behavior insights.
Table of Contents
Over the last century, researchers have found that how our voices sound can tell us a lot about ourselves, including our emotional states and which diseases we may be experiencing. Voice analysis is particularly powerful due to its versatility, non-invasiveness, and low barrier to entry. iMotions has recently established a new partnership with audEERING, a leading company in developing research-grade voice analysis software.
Since the beginning of the year, our teams have worked tirelessly to create a new module, called the Voice Analysis Module, that now enables all iMotions users to add voice analysis to their multimodal research design. This blog post is the first of many initiatives to talk more about how voice analysis is being used in research.
In this longer-than-usual blog, we dive into the biology of our voice and how we can use research tools to derive important insights for behavior and psychology analysis. We also discuss how published research has used voice analysis, and what you need to think about when conducting voice analysis research.
The biology of our voice and what we can learn from it
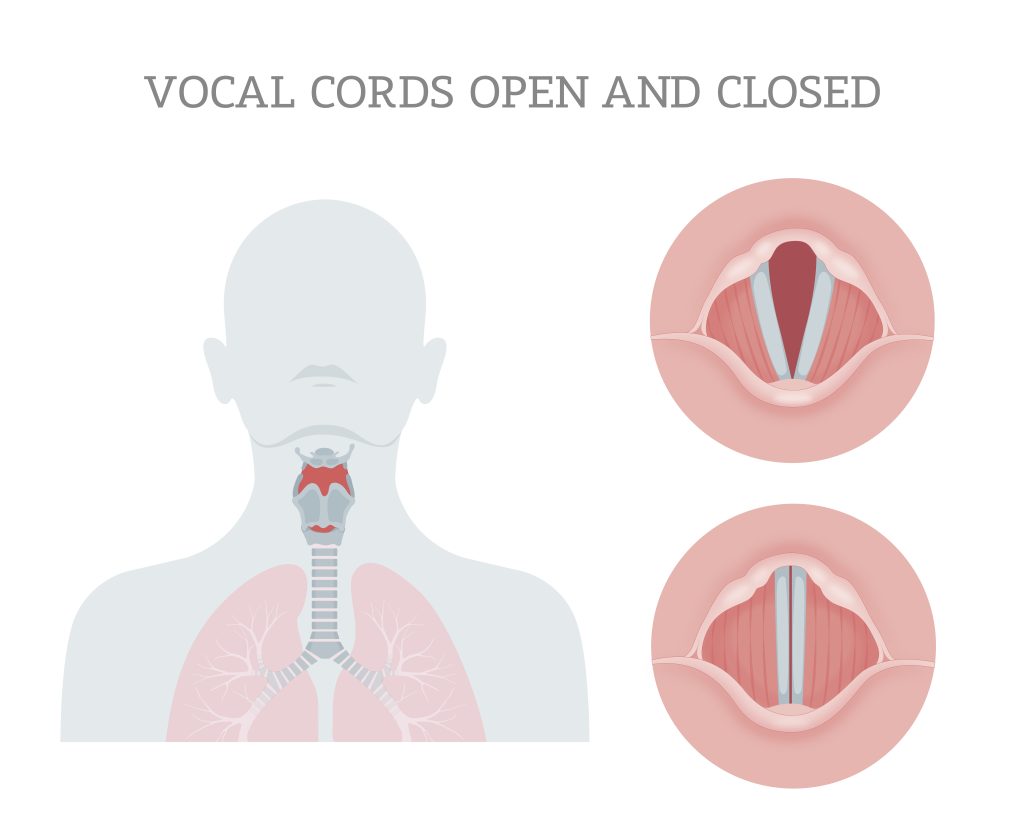
Our voice is made up of a composite of sound waves that consist of many different frequencies. The sound waves come from our vocal cord which produces vibrations via two muscles called vocal folds. When you speak, the folds come together as air from your lungs moves through them. The air blowing through the folds makes them vibrate, thus producing sound.
Our voice is made up of a composite of sound waves that consist of many different frequencies. The sound waves come from our vocal tract and are produced by our larynx, where muscles control the tension of two vocal folds, often also referred to as vocal cords. When you speak, the folds come together as air from your lungs moves through them. The air blowing through the folds makes them vibrate, thus producing sound.
There are two standard ways of categorizing the sounds of our voices:
- Harmonics: Harmonics are the overtones produced by the vibration of the sound source (our vocal folds) and are determined by the shape of the vocal folds.
- Formants: are the key resonant frequencies created by the size and shape of the vocal tract. They create the typical unique sounds of speech phonemes such as /aah/ and /eeh/. When you take voice or singing lessons, you are directly training your vocal tract to produce different formants that will modify the original sound source.
Harmonics and formants are thus determined by our biology, but they are also both modifiable through training.
It is from properties such as harmonics and formants that we infer the actual sound features that we analyze and interpret in voice analysis.
These sound features can be divided into three analytical levels. Let’s go over what they are and how they are measured using audEERING’s voice analysis model in iMotions.
Level 1: Prosody – the most basic metrics to infer from voice analysis
Prosodic analysis is the classic approach to analyzing voices. It is typically used for clinical and linguistic research. Prosodic analysis comprises several features. Here we will focus on the four prosodic features that you can access in iMotions.
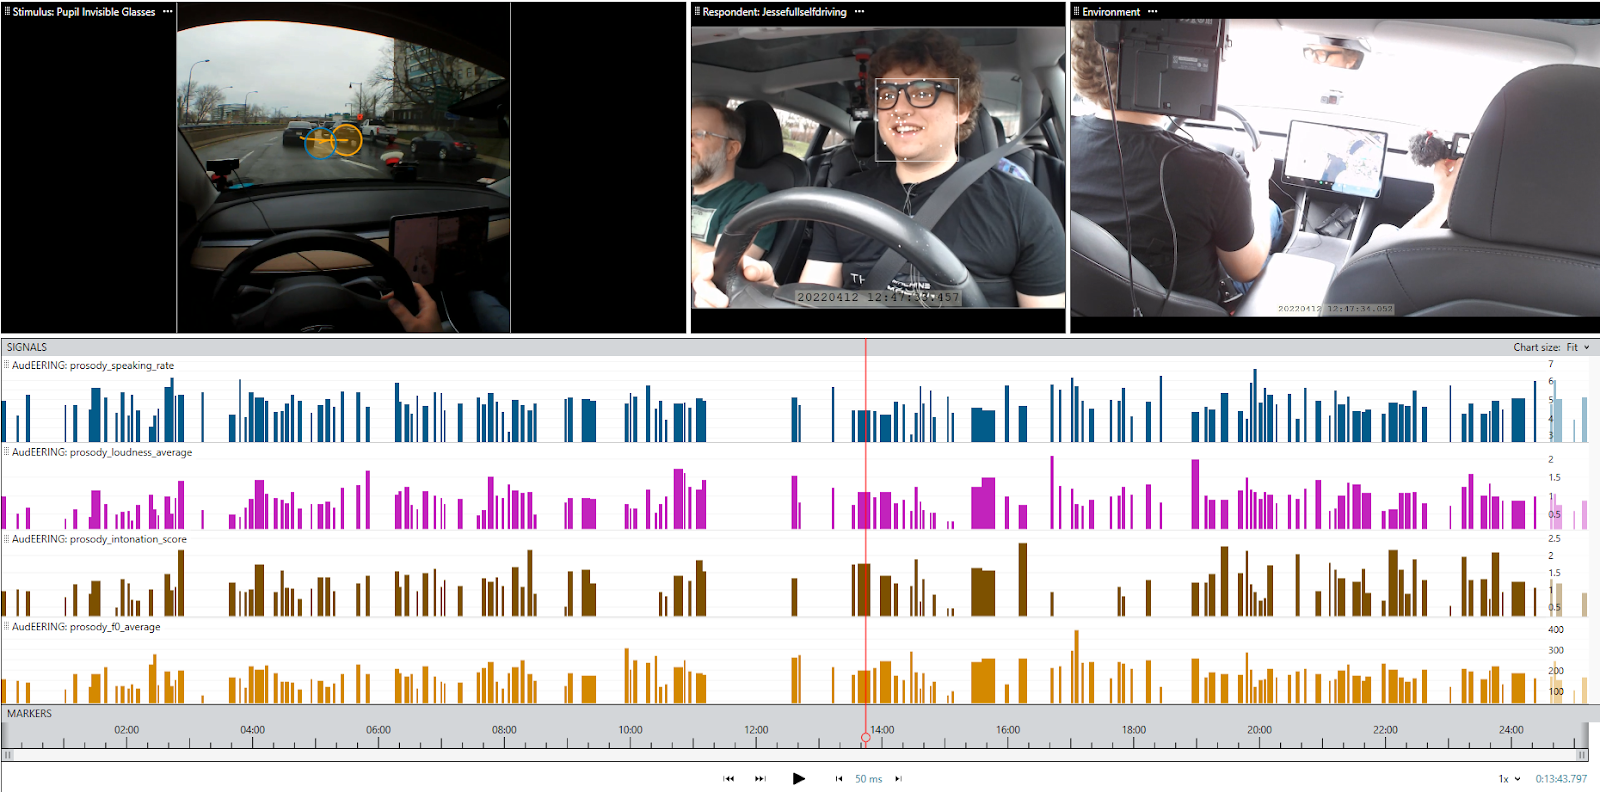
Figure legend: an example of voice analysis data visualization with voice analysis in iMotions
- Pitch: Pitch refers to the perceived frequency of a sound, specifically how high or low a sound is perceived to be. It is closely related to the fundamental frequency of a sound wave, which is the actual physical frequency at which the sound wave vibrates. Higher frequencies result in higher perceived pitch, while lower frequencies are perceived as lower pitch.
Fundamental frequency is referred to as “F0” and is measured in Hertz (Hz). It refers to the number of vibrations of the vocal folds or cycles of the fundamental frequency that occur in one second. In iMotions, you get access to 4 statistical metrics of F0, which are computed over one speech segment: the minimum F0, the average F0, the maximum F0 and the variation of F0. Which metric is most insightful depends on your research question.
Average F0, for example, can be used to differentiate between male and female voices (85-155 Hz vs 165-255 Hz, respectively). A high maximum F0 with a normal average F0, could indicate spontaneous vocal outbursts with high pitch, such as expressions of surprise or disgust.
- Loudness: Loudness is a measure of how loud a human perceives a sound. It is related to the amplitude of the sound wave, but accounts for physiological properties of our hearing, which are known to experts as psychoacoustics. A sound wave with twice the amplitude is not perceived as twice as loud by us; rather, it is perceived as being approximately 1.4 times louder. The relationship between the amplitude of a sound wave and the perceived loudness is not linear but logarithmic. Further, our ear is more sensitive to frequencies in the middle range (1-3 kHz), which we perceive as louder than low or high frequencies with the same amplitude.
The loudness measure in iMotions takes these properties of our hearing into account. The measure is inspired by the scientific loudness model of Zwicker, which measures the loudness in a unit called “Sone”.
In iMotions the model is simplified to work with all kinds of sound sources and microphones and thus does not have a calibration to physical units of sound wave energy, the loudness measure is a score value ranging from 0.0 (silence) – 1.0 (maximum possible loudness) without a physical unit of measurement.
Similar to F0, loudness of one speech segment can be measured as the minimum, average, maximum or variation. Loudness is regularly reported in clinical studies to differentiate between patient populations.
Due to the relation of loudness to signal amplitude, the loudness measure is influenced by the microphone recording level (gain) and the distance of the microphone and sound source (e.g. the person speaking). If these conditions vary throughout your set-up, you should not compare loudness values across these varying conditions, but rather within constant conditions, such as the same microphone (ideally headset/lapel at fixed distance to mouth) and same recording levels (disable automatic recording level control or automatic gain control (AGC) features!).
- Speaking rate: Speaking rate refers to the rate with which you speak and is measured as the number of syllables per second and its variation within one speech segment. When the variation of speaking rate is low, it indicates that the voice has a steady pace, while a high variation indicates changing pace, e.g. slowing down on important utterance parts and speeding up on less important parts. A high variation could also indicate the presence of filled pauses and hesitations (like “uh”), due to thinking aloud or higher cognitive load. Values of average speaking rate of 3-5 are normal, below 3 slower speech and above 5 faster speech. If there are more pauses in a speech segment, the measured average value might be lower than the actual perceived speaking rate.
- Intonation: Intonation is the measure of the rise and fall of the voice (e.g. a measure of how much pitch is being varied within one speech segment). It is useful for measuring how monotonously (low intonation value) or lively (high intonation value) a person is speaking. The sentence structure is not taken into account, i.e. no full scale analysis of intonation patterns is performed. Intonation scores are derived from pitch standard deviation and have a typical range of 0.4 – 1.6.
Values below 0.4 indicate monotonous speech
Values above 1.6 indicate lively speaking
Values of 1.0 indicate normal, average intonation
Level 2: Emotional dimensions – capturing the emotional expressions in a voice
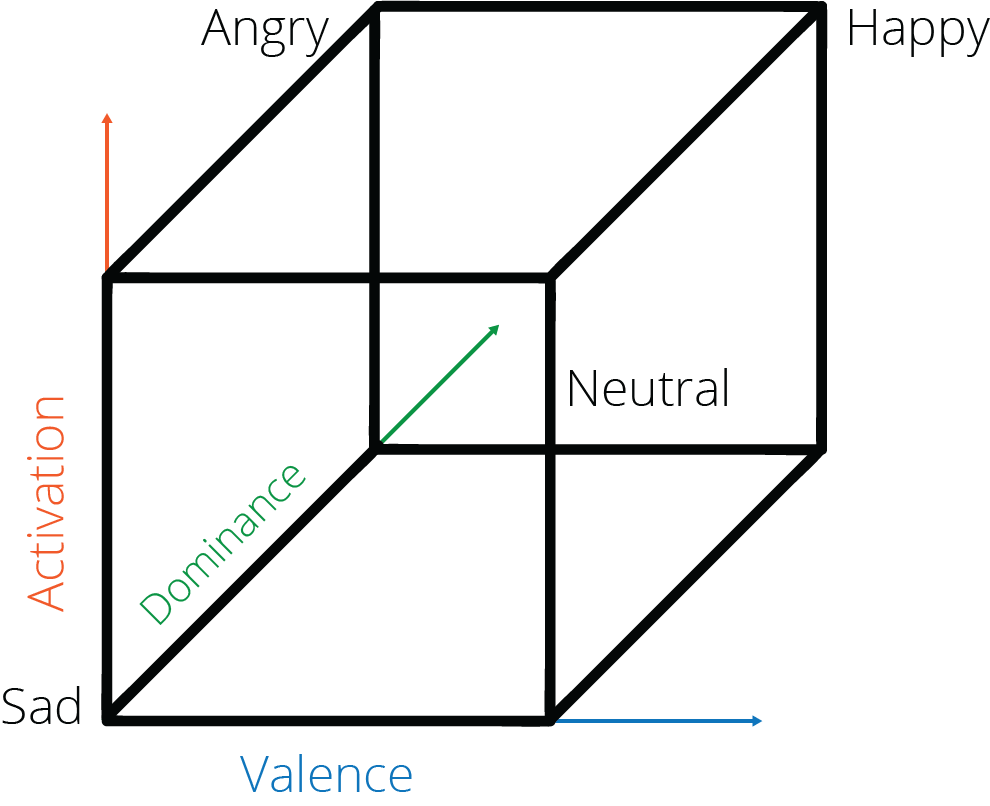
Emotional dimension analysis is particularly useful in social and behavioral research that are interested in personality characteristics and performance. There are three emotional dimensions, and they are typically visualized in a 3D space with bipolar axes (see figure on page X) (figure reference)). All these emotional dimension metrics are reported as a value ranging from -1 to +1.
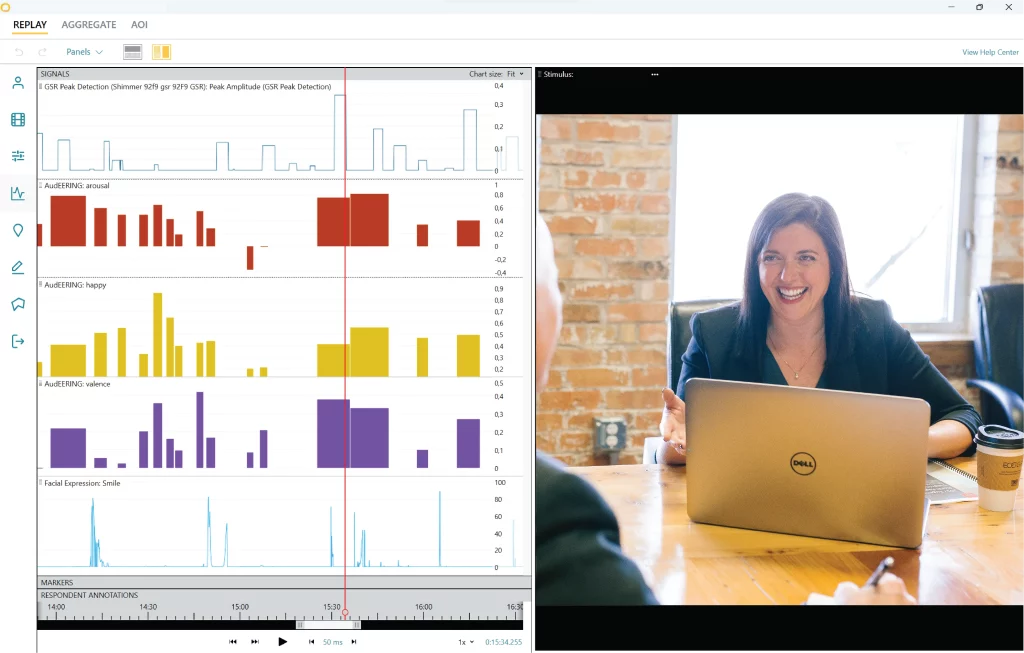
Figure legend: an example of voice analysis data visualization with voice analysis in iMotions
- Arousal: arousal indicates the arousal level of the sound of a voice, and is measured in a range from high to low. Arousal can be used to infer whether an event had a calming/soothing or exciting/agitating effects on a person.
Generally, low arousal scores (closer to -1) can be interpreted as indicating sadness, relaxation, fatigue, depression or contentment. While high arousal scores (closer to +1) typically indicate joy, fear, outrage or excitement. - Dominance: dominance indicates the dominance level of the sound of a voice and is measured in a range from low to high. Dominance can be used to infer how submissive or controlling a speaker feels.
Typically, low dominance indicates a state of fear, while high dominance indicates a state of pride. - Valence: valence indicates the affect of a voice, and is measured as a range from positive to negative. Valence can be used to infer whether an event had an unpleasant/negative or pleasant/positive effect on a person.
Generally, a negative valence indicates a state of anger, sadness, fear, grief or boredom. In contrast a positive valence indicates a state of relaxation, contentment, happiness and excitement.
Level 3: Emotion detection
The highest data level which derives emotional states based on the prosody and emotional dimensions.
This metric is particularly useful for studies that assess people’s performance and emotional response to events.
In the field of voice analysis, there are 4 emotion categories that are derived from voice, all of which you can access in iMotions based on AudEERING’s voice analysis software. These are: happy, neutral, sad and angry. Their scores range from 0-1, and each voice segment will amount to an emotion score of 1. The emotion with the highest score (i.e. closer to 1), will represent the most dominant emotion during that voice segment.
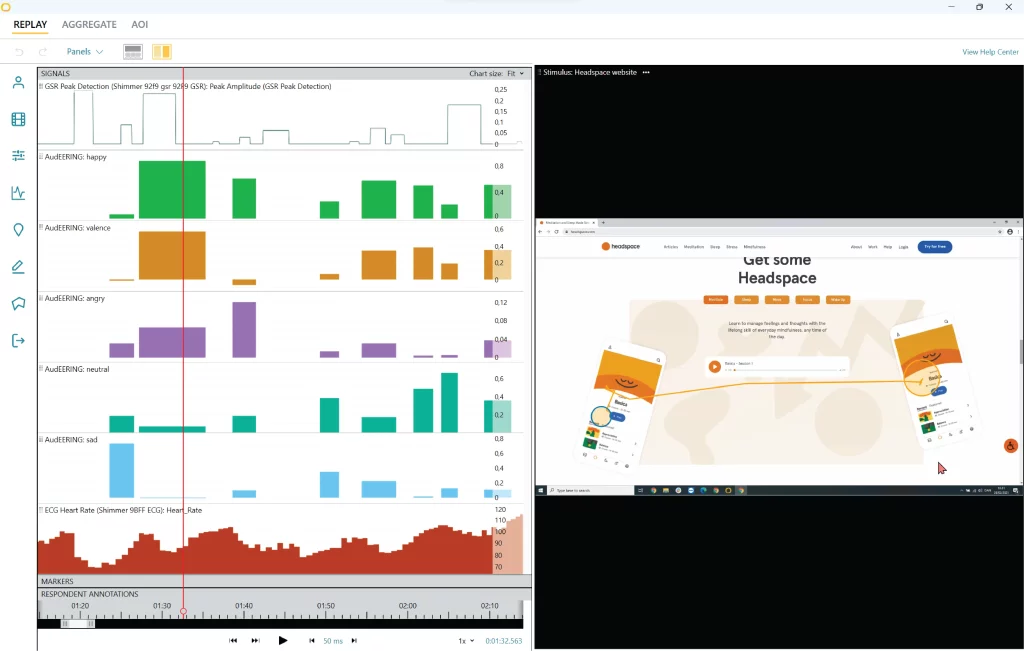
Figure legend: an example of voice analysis data visualization with voice analysis in iMotions
Emotion dimensions and emotion categories are often visualized in a 3D space with bipolar axes, which visualizes how the emotion dimension scores correlate with the emotion scores (figure reference).
How do researchers use voice analysis?
Voice analysis is used in all applications, but its value is particularly well demonstrated in the context of clinical research. For example, voice analysis can identify biomarkers for Parkinson’s Disease, depression and malignant throat polyps. Voice analysis is increasingly used in social and behavioral sciences where it can detect changes in emotional states. At iMotions, we are excited to see voice analysis moving into emerging research fields such as automotive, human-factors, and performance science. In the following we first provide examples of how voice analysis is applied in three different research areas, and subsequently how voice analysis is utilized with different research designs.
There are three major research areas utilizing voice analysis:
- Clinical research: clinical research has utilized voice analysis for decades to differentiate between clinical populations. For example, studies have identified voice biomarkers for dysarthric speech, depression, Alzheimer’s Disease and Parkinson’s Disease (Narendra and Alkul, 2018; Bocklet et al., 2013; Taguchi et al., 2018 Han et al., 2018; Meilan et al., 2013). In clinical research, voice analysis is also used to assess treatment efficacy. For example, one study evaluated the efficacy of a social anxiety treatment using voice analysis (Laukka et al., 2008).
In clinical research, voice analysis is typically published as a part of highly controlled, in-lab research studies where the participant is performing a speaking task while facing a computer or as a part of a clinical interview.
- Social and behavioral research: voice analysis is very popular in the social and behavioral science field to better understand how our voice reflects our personality, affects the people around us or how different factors influence how we perceive other voices. For example, famous studies have assessed how menstrual periods change women’s preference for male voice features (Puts, 2005), while other studies have assessed how changing the sound of your voice affects your self-perception (Stel et al., 2011). Voice analysis has also been used to predict the outcome of elections (Banai et al., 2017).
Just like clinical research, social and behavioral sciences often perform their research for voice analysis in controlled lab settings. However, it is more common for this research field to use pre-recorded video or audio files to analyze “real-world” voices.
- Marketing and business research: Marketing and business research apply voice analysis to optimize several aspects of their key function including their communication and sales strategies. Commercial researchers do most often not publish their results, but it is well known that voice analysis is used commercially in call centers and UX design.
- Voice analysis is particularly powerful because of its versatility in data collection. It is therefore common to see voice analysis used in very different types of study designs. Some of the most common study designs applying voice analysis are the following:
- Think-aloud tests: Think aloud tests refer to a study design where participants are instructed to speak what is on their mind while they are performing a task. This strategy is often seen in user-experience research, see for example these studies: https://dl.acm.org/doi/abs/10.1145/3325281 + https://www.mingmingfan.com/papers/CHI21_OlderAdults_ThinkAloud_UXProblems.pdf
- Dyadic interactions: dyads refer to two people communicating. Dyad research is different from interviews with an interviewer and interviewee (see below), since they typically occur as natural conversations between two colleagues, friends or panelists. For example, voice analysis can be applied to assess the emotional state of dyads during a team task (https://dl.acm.org/doi/abs/10.1145/3136755.3136804), or to explore the tone (and modification) of voice between low- and high-status people (https://psycnet.apa.org/doiLanding?doi=10.1037%2F0022-3514.70.6.1231 ).
- Presentations: Presenting with an engaging voice is becoming an increasing demand, and voice analysis has already played a role in differentiating between highly engaging and low engaging speakers. See for example this study comparing the voice features of Steve Jobs during presentations to the average speaker:
https://www.sciencedirect.com/science/article/abs/pii/S0747563216304873 . Along those lines, it makes sense that voice analysis is applied to performance optimization and public speaking coaching. - Interviews: interviews are regular activities in work-places and healthcare settings. Clinical interviews are particularly well studied with voice analysis, for example in depression (https://dl.acm.org/doi/abs/10.1145/2663204.2663238), coronary disease (https://journals.lww.com/psychosomaticmedicine/Citation/1977/07000/Assessment_of_Behavioral_Risk_for_Coronary_Disease.3.aspx.)
- Automotive: While this is still a new field, voice analysis holds great promise for automotive research. A major reason for this potential is that voice analysis is a non-invasive sensor that can be recorded within the car without requiring the person to put on any additional hardware (although you might want to consider a microphone for the highest quality depending on the environmental noise). Voice analysis has been used to detect fatigue and substance use, and could be a game-changer for automotive companies that strive to automatically identify a driver’s cognitive state. We have conducted in-house studies to demonstrate the feasibility of this approach.
- Think-aloud tests: Think aloud tests refer to a study design where participants are instructed to speak what is on their mind while they are performing a task. This strategy is often seen in user-experience research, see for example these studies: https://dl.acm.org/doi/abs/10.1145/3325281 + https://www.mingmingfan.com/papers/CHI21_OlderAdults_ThinkAloud_UXProblems.pdf
What to think about when conducting voice analysis research
Just like any other type of research, there are several things to consider when designing your experiments and gathering the highest quality data.
First, you want to make sure that you use a proper microphone and conduct the recording in an appropriate environment. As for the microphone, most computers constructed from 2020 onwards have internal microphones that are perfectly suitable for collecting voice recordings for analysis. However, depending on your setup, you may want to consider using an external microphone. In that case, make sure to use a USB-connected microphone from a reputable brand. As for the recording environment, it is always advisable to collect data somewhere without high levels of noise. This could be in the laboratory, in an office or in the home of the participant (but remember to tell them to turn off the TV and keep the dog in the garden!).
It is recommended that for each stimulus, you gather 60 seconds or more of voice data from each participant. And if you plan to aggregate your data across groups, expect to have a sample size of 20-40 people (per group). Of course, this recommendation will depend on the purpose of the study and the stimuli presented.
How to know whether voice analysis is for you
At this point, you know how we can measure and use vocal features to learn more about human behavior, cognition and performance, and you know how other researchers leverage this technology. You might ask yourself whether your own research could benefit from voice analysis. Below are some qualifying questions you can ask yourself:
- Do your experiments involve participants speaking either naturally (e.g. in conversations or as a reaction to an experience) or as a part of the study design (e.g. an interview or Think Aloud test)
- Are you interested in understanding people’s emotional states?
- Are you interested in identifying new biomarkers or create predictive models for different diagnosis
If you can answer yes to any of these questions, then voice analysis might be for you!
But hold your horses: while voice analysis is an exciting addition to your research, it is one of several technologies that can interrogate people’s behaviors, thoughts, and emotions. Voice analysis will capture unique aspects of human behavior that other sensors cannot, but it is much stronger in combination with other sensors, such as facial expression analysis, eye tracking, and electrodermal activity.
Free 22-page Voice Analysis Guide
For Beginners and Intermediates
- Get a thorough understanding of the essentials
- Valuable Voice Analysis research insight
- Learn how to take your research to the next level