
Our comprehensive manual on experimental design provides guidance on avoiding common mistakes and pitfalls when establishing the optimal experiment for your research.
Table of Contents
Introduction to experimental methods
Humans are a quite curious species. We explore new grounds, improve products and services, find faster and safer ways to produce or transport goods, and we solve the mysteries of global diseases. All of these activities are guided by asking the right questions, by searching for answers in the right spots and taking appropriate decisions. Academic and commercial research have professionalized this quest for knowledge and insights into ourselves and the world surrounding us.
Every day, research institutions across the globe investigate the inner workings of our universe – from cellular levels of our synapses and neurons to macroscopic levels of planets and solar systems – by means of experimentation. Simply put: Experiments are the professional way to answer questions, identify cause and effect or determine predictors and outcomes. These insights help us understand how and why things are what they are and can ultimately be used to change the world by improving the good and overcoming the bad.
N.B. this post is an excerpt from our Experimental Design Guide. You can download your free copy below and get even more insights into the world of Experimental Design.
Free 44-page Experimental Design Guide
For Beginners and Intermediates
- Introduction to experimental methods
- Respondent management with groups and populations
- How to set up stimulus selection and arrangement
In contrast to the early years of scientific research, modern-age experiments are not merely results of scientists randomly probing assumptions combined with the pure luck to be at the right place at the right time and observe outcomes.
Today’s scientific insights are the result of careful thinking and experimental planning, proper collecting of data, and drawing of appropriate conclusions.
Experimental Design Example
Researchers use experiments to learn something new about the world, to answer questions or to probe theoretical assumptions.
Typical examples for research questions in human cognitive-behavioral research are:
• How does sensory stimulation affect human attention? How do, for example, moving dot patterns, sounds or electrical stimulation alter our perception of the world?
• What are the changes in human physiology during information uptake? How do heart rate and galvanic skin response, for example, change as we recall correct or incorrect information?
• How does virtual reality compared to real physical environments affect human behavior? Do humans learn faster in the real world compared to VR?
• How does stress affect the interaction with other colleagues or machines in the workplace?
• How does packaging of a product affect shoppers’ frustration levels? Is the new package intuitive to open, and if not, how does it affect the behavior of the person?
• How does the new TV commercial impact on emotional expressions and brand memory? Does gender have an influence on purchase decisions after watching the ad?
• How does a website affect users’ stress levels in terms of galvanic skin response, ECG and facial expressions?
• Which intersections in town cause most frustration in bicyclists?
• What are the aspects in a presidential campaign speech that drive voters’ decisions?
As you can see, research questions can be somewhat generic. Experiments are supposed to clarify these questions in a more standardized framework. In order to do so, several steps are necessary to fine-tune the research question into a more testable form:
Step 1: Phrase a hypothesis
First, the general research question is broken down into a testable hypothesis or several hypotheses. Hypotheses are explicit statements about cause and effect and address what outcomes occur when specific factors are manipulated:

Hypotheses phrase a relationship between one or more independent variables and one or more dependent variables:
•Independent variable
The independent variable (IV) is strategically changed, or manipulated, by the experimenter. IVs are also referred to as factors.
• Dependent variable (DV)
The dependent variable (DV) is measured by the experimenter. Experiments with one DV are called univariate, experiments with two or more DV are called multivariate.
The general research question “How does stress affect the interaction with others?” might lead to the following hypotheses about how stress (independent variable) affects interaction with others (dependent variable):
1) “Having to reply to 100 or more incoming emails per hour results in reduced verbal interaction with colleagues.”
Independent variable: Number of emails per hour
Dependent variable: Number of verbal interactions with colleagues per hour
2) “Sleeping 8 hours or more per night results in increased informal sport activities
with colleagues.”
Independent variable: Duration of sleep per night
Dependent variable: Number of sport meetups with colleagues per week
3) “Regular physical exercise in the evening results in increased occurrences of
smiles when talking to others in business meetings.”
Independent variable: Number of evening sport activities per week
Dependent variable: Smile occurrences when talking with others
Hypotheses make the research question more explicit by stating an observable relationship between cause and effect. Hypotheses also determine which stimuli are used and what respondents are exposed to.
A stimulus doesn’t have to be just pictures or tones, much more constitutes a stimulus, for example, questionnaires, websites, videos, speech and conversations with others, visual and proprioceptive input while driving and much more. We will address stimuli in more detail below.
Step 2: Sample Groups
Define sample groups
After specifying the hypothesis, you need to clarify the respondent group characteristics for your experiment. This step is necessary to exclude side effects that could alter the outcomes of your experimental data collection. Make sure that demographic characteristics such as age, gender, education level, income, marital status, occupation etc. are consistent across the respondent pool. Individual characteristics such as state of health or exposure to certain life events should be considered as they might affect experimental outcomes. For example, mothers might respond differently to a TV ad for baby toys than women without kids. Soldiers suffering from PTSD might respond differently to stress-provoking stimuli than software developers.
Step 3: Assign subjects to groups
In this step, you randomly distribute subjects to the different experimental conditions. For example, for your stress in the workplace study you could create two experimental groups, where group one receives 10 emails per hour, and group two receives 100 emails per hour. You could now analyze how the two groups differ in their social interaction with others within the next 6 hours. Ideally, the assignment to experimental groups is done in a randomized fashion, such that all respondents have the same probability for ending up in the available experimental groups. There should not be any bias to assign specific respondents to one group or the other.
Step 4: Determine sampling frequency.
How often do you want to measure from respondents? Clinical trials typically measure patients’ state of health once per month over the course of several months or years. In usability studies you might ask respondents once at the end of the session several questions, either verbally or via surveys and questionnaires.
However, when you collect cognitive-behavioral data from EEG, EMG, ECG, GSR or other biosensors while respondents are doing a specific task, you are collecting tens to hundreds of data points per second – even though all of these sub-second samples might be used to compute an overall score reflecting a certain cognitive or affective state. We will address later in this guide which sensors are ideal to collect specific cognitive-behavioral metrics.
Step 5: Conduct the experiment and collect data.
In this step, you execute the experimental paradigm according to the selected methods. Make sure to observe, monitor, and report any important moments during data collection. Prior to conducting the experiment, run a pilot test to rule out any issues that might arise during data collection (stimulus was wrong length/non-randomized/not optimal, etc.)
Check out : 7 Tips & Tricks For a Smooth Lab Experience
Step 6: Pre-process data and analyze metrics.
In human cognitive-behavioral research, raw data can consist of self-reports or data from biosensors. Of course, video footage of experimental sessions such as focus groups and interviews also constitute raw data and have to be analyzed using coding schemes. Due to the wide range of statistical methods to analyze raw data and metrics, we will not address this step in the current guide. However, one crucial aspect should be mentioned here: The selection of a specific statistical method for data analysis should always be driven by the original hypothesis and the collected data.
Of course, not all experiments require the precise specification of all of these steps. Sometimes you as a researcher don’t have control of certain factors, or you are lacking access to specific respondent populations. Dependent on the amount of control that you have over the relationship between cause and effect, the following types of experiments can be distinguished:
Types of Experimental design
1. Laboratory experiments
Whenever we speak informally of experiments, lab experiments might come to mind where researchers in white lab coats observe others from behind one-side mirrors, taking minute notes on the performance and behavior of human participants executing key-press tasks in front of somewhat unpredictable machines. In fact, this is how human cognitive-behavioral research started (see the Milgram experiment).
Gladfully, the days of sterile lab environments are long gone, and you can run your study wearing your favorite sweater. However, a core aspect still holds: Being able to control all factors and conditions that could have an effect. For example, in lab experiments you can select specific respondent groups and assign them to different experimental conditions, determine the precise timing and configuration of all stimuli, and exclude any problematic side-effects.
What you should know about laboratory experiments…
Strengths.
- Precise control of all external and internal factors that could affect experimental outcomes.
- Random assignment of respondents to experimental groups, ideally by means of randomization.
- Allows identification of cause-effect relationships with highest accuracy.
- Since everything is standardized, others can replicate your study, which makes your study more “credible” compared to non-standardized scenarios.
Limitations.
- Controlled experiments do not reflect the real world. Respondents might not respond naturally because the lab doesn’t reflect the natural environment. In technical terms, lab experiments are lacking ecological validity.
- Observer effects might change respondents’ behavior. An experimenter sitting right next to a respondent or observing them via webcam might bias experimental outcomes (read up on the Hawthorne Effect).
2. Field experiments
In contrast to lab experiments, field experiments are done in the natural surroundings of respondents. While the experimenter manipulates the “cause”-aspect, there’s no control of what else could potentially affect the effects and outcomes (such as the Hofling’s Hospital Experiment based on Milgram‘s work).
Quite often, engineers also conduct field tests of prototypes of soft- and hardware to validate earlier lab tests and to obtain broader feedback from respondents in real life.
What you should know about field experiments…
>> Strengths.
- Field experiments reflect real-life scenarios more than lab experiments. They have higher ecological validity
- When experiments are covert and respondents don’t feel observed, the observed behavior is much closer to real life compared to lab settings.
>> Limitations.
- No control over external factors that could potentially affect outcomes. The outcomes are therefore much more varied. More respondents are therefore needed to compensate the variation.
- Difficult to replicate by others.
- Limited ability to obtain informed consent from respondents.
3. Natural experiments.
Natural experiments are pure observation studies in the sense that the experimenter doesn’t have any control. Respondent groups are observed as-is and not strategically assigned to different experimental conditions.
You might want to compare existing iPhone and Android users, people living close to Chernobyl and people living somewhere else, or patients suffering from cancer and healthy populations. In this case, the groups that you’d like to compare already exist by nature – you don’t have to create them.
What you should know about natural experiments…
Strengths.
- Behavior in natural experiments more likely reflects real life.
- Ideal in situations where it would be ethically unacceptable to manipulate the group assignment (e.g., expose respondents to radiation).
Limitations.
- More expensive and time-consuming than lab experiments.
- No control over any factors implies that replication by others is almost impossible.
How can I measure human behavior?
Laboratory, field and natural experiments all have one aspect in common: Insights are accomplished empirically. “Empirical” means that research questions and hypotheses are not answered by mere reflection or thought experiments.
Instead of leaning back in a chair and pondering over the potential outcomes of a thought experiment, researchers in human cognitive-behavioral science accomplish their work by means of active observation and probing of the environment in order to identify the underlying processes as well as the ultimate “driving forces” of human behavior.
Within the last decades, researchers have developed intricate experimental techniques and procedures that have found their way also into commercial testing of emotional, cognitive and attentional effects of new products and services, or how personality traits and problem-solving strategies have an impact on brand likeability and consumer preferences.
Two ways to study Human Behavior
Qualitative studies on Human Behavior
Qualitative studies gather observational insights. Examples include the investigation of diary entries, open questionnaires, unstructured interviews or observations. Because nothing is counted or quantified and every observation is described as-is, qualitative data is also referred to as descriptive.
In qualitative field studies or usability studies, for example, researchers directly observe how respondents are using the technology, allowing them to directly ask questions, probe on behavior or potentially even adjust the experimental protocol to incorporate the individual’s behavior. The focus of qualitative studies is primarily on understanding how respondents see the world and why they react in a specific way.
What you should know about qualitative studies…
Strengths.
- Ideal to answer “why” and “how to fix a problem?” questions.
- Focus on individual experience of the respondent.
- Small respondent samples required.
Limitations.
- Knowledge gained in the specific study might not be transferrable to other groups.
- Data collection might take longer per respondent.
- Risk that results are affected by researcher’s biases and preferences.
Typical use cases.
- UX, web and software usability tests (description of user journeys).
- Open-ended interviews and surveys on biographical events.
- Focus groups with / without experimenter present.
Check out: How to Deliver better UX with Emotion Detection
Quantitative studies
Quantitative studies by contrast, quantitative studies characterize the systematic empirical investigation of observable phenomena via statistical, mathematical or computational techniques. In other words, quantitative studies use numbers to describe and characterize human behavior.
Examples for quantitative techniques include structured surveys and interviews, observations with dedicated coding schemes (e.g., counting the number of cigarettes smoked within a day), or physiological measurements from EEG, EMG, ECG, GSR and other sensors producing numerical output. Whenever researchers are using quantitative methods, they translate behavioral observations into countable numbers and statistical outputs. All of this is done to guarantee maximum experimental control.
What you should know about quantitative studies…
Strengths.
- Ideal for answering “how many” and “how much” questions.
- Useful to analyze large respondent groups, focus on entire populations.
- High amount of standardization requires less time than qualitative studies.
- Provides numerical values that can be analyzed statistically.
Limitations.
- Experimenter might miss out phenomena because the measurement tool is too narrow.
- Contextual factors are often ignored or missing.
- Studies are expensive and time-consuming.
Typical use cases.
- Behavioral observation using coding schemes (e.g., on facial expressions or action occurrences within a certain time frame)
- Structured interviews and surveys containing single- or multiple-choice questions as well as scales.
- Physiological measurements of bodily processes (EEG, EMG, GSR etc.)
Psychology Research with iMotions
The world’s leading human behavior software
Check out: Qualitative vs Quantitative Research
Which numbers could human cognitive-behavioral research potentially use to describe our complex inner workings, our intelligence, personality traits or skill levels? What are measurable indicators of a person being a shopaholic, for example?
Indicators that can be counted might be the average time spent in department stores during a week, the cumulative amount of money laid out for certain lifestyle products, or the number of shoe boxes filling up the closet under the stairs (have a look at our reading tip on measurement and the assignment of numbers or events).
The basic principle is that hidden factors of our personality can be made visible (and therefore measurable) by breaking them into feasible and tangible, graspable and observable units which can be counted numerically. This “making visible” of latent constructs of our personality and identity is referred to as operationalization.
While some measures are more suitable to capture an underlying latent characteristic, others might fail. So the question is, what actually constitutes an appropriate measure?
Measurements to avoid bias
This is generally described with respect to the following criteria:
Objectivity
Objectivity is the most general requirement and reflects the fact that measures should come to the same result no matter who is using them. Also, they should generate the same outcomes independent of the outside influences. For example, a multiple-choice personality questionnaire or survey is objective if it returns the same score irrelevant of whether the participant responds verbally or in written form. Further, the result should be independent of the knowledge or attitude of the experimenter, so that the results are purely driven by the performance of the respondent.
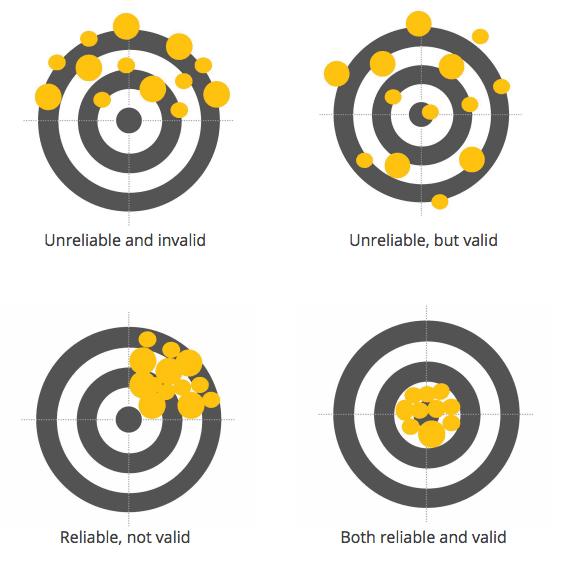
Reliability
A measure is said to have high reliability if it returns the same value under consistent conditions. There are several sub-categories of reliability. For example, “retest reliability” describes the stability of a measure over time, “inter-rater reliability” reflects the amount to which different experimenters give consistent estimates of the same behavior, while “split-half reliability” breaks a test into two and examines to what extent the two halves generate identical results.
Validity
This is the final and most crucial criterion. It reflects the extent to which a measure collects what it is supposed to collect. Imagine an experiment where body size is collected to measure its relationship with happiness. Obviously, the measure is both objective and reliable (body size measures are quite consistent irrespective of the person taking the measurement) but it is truly a poor measure with respect to its construct validity (i.e., its capability to truly capture the underlying variable) for happiness.
Once you have identified measures that fulfill objectivity, reliability and validity criteria at the same time, you are on the right track to generate experimental outcomes that will push beyond the frontiers of our existing knowledge.
Respondent Management
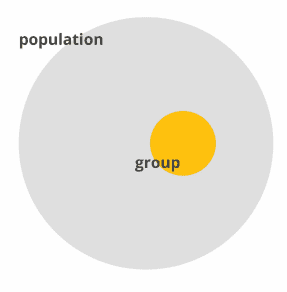
While Iceland has research programs where experiments are applied to the entire nation, other countries and situations do not allow testing everybody. Of course, it would grant maximum insights into your research question, but due to time and resource constraints studies and experiments are generally carried out on respondent groups rather than entire populations.
The most challenging part is to find respondents that truly represent the larger target population allowing you to generalize, or infer, from your study group findings to the population. You might have heard the phrase “representative sample” before. This describes respondent groups where each and every member of the population has an equal chance of being selected for your experiment. Populations don’t necessarily have to be entire countries – the term simply reflects “all people that share certain characteristics” (height, weight, BMI, hemoglobin levels, experience, income, nationality etc.) which are considered relevant for your experiment.
Exemplary populations are:
- Female academics between 30 and 40 years in the US with an average annual income of $50k
- Software developers with more than 5 years of experience in C#
- Dog owners
- Patients suffering from secondary progressive Multiple Sclerosis
- After-work shoppers of any age and gender
- Danish mothers up to 50 years
- People wearing glasses
- Danish mothers up to 50 years
- People wearing glasses
A sample now can be a group of 100 Multiple Sclerosis patients, or 20 dog owners. Finding “representative samples” is not that easy as there is some bias in almost all studies. Samples can be found as following:
Non-random respondent sampling
Non-random sampling can be done during initial pre-screening phases, where generalization is not important. In that case, the experimental outcomes only apply to the tested respondent group.
Sampling is done as following:
- Volunteers. You ask people on the street, and whoever agrees to participate is tested.
- Snowball sample. One case identifies others of his kind (e.g., HSE shoppers).
- Convenience sample. You test your co-workers and colleagues or other readily available groups.
- Quota sample. At-will selection of a fixed number from several groups (e.g., 30 male and 30 female respondents).
Random respondent sampling.
Random sampling is actually giving everyone in the population the same chance of being included in your experiment. The benefit of being able to conclude from your research findings obtained from several respondents to the general public comes, however, with high demands on time and resources.
The following random sampling strategies exist:
Simple random sampling
In random samples chances for everyone are identical to being included in your test. This means that you had to identify, for example, every female academic between 30 and 40 years in the US with an average annual income of $50k, or every dog owner. Subsequently, you draw random samples and only contact those. Random sampling disallows
any selection bias based on volunteering or cooperation.
Systematic sampling
Instead of a completely random selection, you systematically select every nth person from an existing list, for example ordered by respondent age, disease duration, membership, distance etc.
Multistage sampling
Sampling can be done in multiple steps. For example, to find representative students for testing, you can first draw a random selection of counties, then proceed with random drawing of cities, schools, and classes. Finally, you randomly draw students for observation and recording.
Cluster sampling
Particularly for self-reports, studies are carried out on large and geographically dispersed populations. In order to obtain the required number of respondents for testing, clusters may be identified and randomly drawn. Subsuequently, all members of the drawn samples are tested.
For example, clustering might be done using households – in this case, all household members are tested, reducing the time and resources for testing massively.
Which sampling method you use is generally determined by feasibility in terms of time and resources. It might often be difficult to obtain truly random samples, particularly in field research. You can find more details on suggested procedures for representative sampling in Banerjee and colleagues (2007; 2010).
How many respondents do I need?
Sampling strategies are closely linked to the sample size of your experiment. If you would like to do a single case study, of course only one respondent is needed. In this case, however, you cannot generalize any findings to the larger population. On the other hand, sampling from the entire population is not possible. The question is, how many respondents are suitable for your experiment? What is the ideal sample size?
Martinez and colleagues (2014) as well as Niles (2011) provide recommendations. Without delving too deep into statistics, the main message is about this: Always collect as many respondents as necessary. For quantitative usability testing 20 respondents might be sufficient, but more respondents should be tested whenever the expected effects are smaller, for example, if there’s only subtle differences between the different stimulus conditions.
This is why academic researchers run studies with dozens to hundreds or thousands of respondents. With more respondents, you reduce the ambiguity of individual variation that could have affected experimental outcomes.Top of Page
Confidence
The amount of security about your findings is typically expressed with respect to confidence, which is roughly expressed with the following formula:
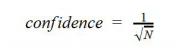
N is the sample size. As you can see, higher respondent samples cause confidence to become smaller (which is the desired outcome). In other words, testing more people gives you more accurate results.
For example, if you tested the preference for a new product with 10 out of 10,000 respondents, then the confidence is at 32%. If 7 out of 10 respondents (70%) liked the new product, the actual proportion in the population could be as low as 48% (70-32) and as high as 100% (70+32, you can’t be above 100). With a variation from 48% to 100%, your test might not be that helpful.
If you increase the sample size to 100 respondents out of 10,000, the confidence is at 10%. With 70 out of 100 respondents liking the product, the actual value in the population is somewhere between 60% and 80%. You’re getting much closer!
If you would like to further reduce the confidence to 5%, you have to test at least 500 randomly-selected respondents. The bottom line is, you have to test lots of respondents before being able to get to conclusions. For more information visit the Creative Research Systems website, where you can find a more exact formula as well as a sample size calculator tool.
Cross-sectional vs. longitudinal designs
Experimental design and the way your study is carried out depends on the nature of your research question. If you’re interested in how a new TV advertisement is perceived by the general public in terms of attention, cognition and affect, there’s several ways to design your study. Do you want to compare cognitive-behavioral outcomes of the ad among different populations of low and high-income households at the same point in time? Or, do you want to measure the TV ad effects in a single population (say, male high-income shoppers with specific demographic characteristics) over an extended period of time? The former approach is generally referred to as cross-sectional design. The latter is called longitudinal design. The two can further be combined (mixed design)
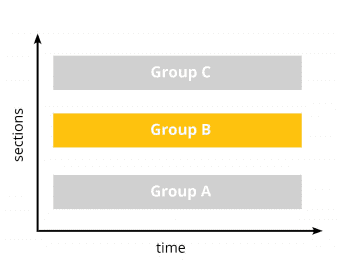
Cross-sectional design
In cross-sectional studies two or more groups are compared at a single point in time. Similar to taking a snapshot, every respondent is invited and tested just once. In our example, you would show the new TV ad to respondents from low- and high-income households. You would not, however, invite them and show them the TV ad again a week later.
Other examples of cross-sectional studies are:
- Gaming. Compare effects of video games on emotional responsiveness of healthy children and children suffering from ADHS.
- Web testing. Compare website usability evaluation of young, middle-aged and senior shoppers.
- Psychology. Compare evaluation of parenting style of mothers and fathers.
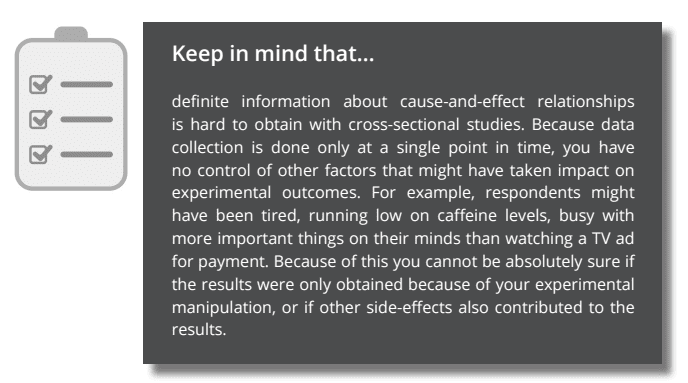
The primary benefit of a cross-sectional experimental design is that it allows you to compare many different variables at the same time. You could, for example, investigate the impact of age, gender, experience or educational levels on respondents’ cognitive-emotional evaluation of the TV ad with little or no additional cost. The only thing you have to do is collect the data (for example, by means of interviews or surveys).
Longitudinal design
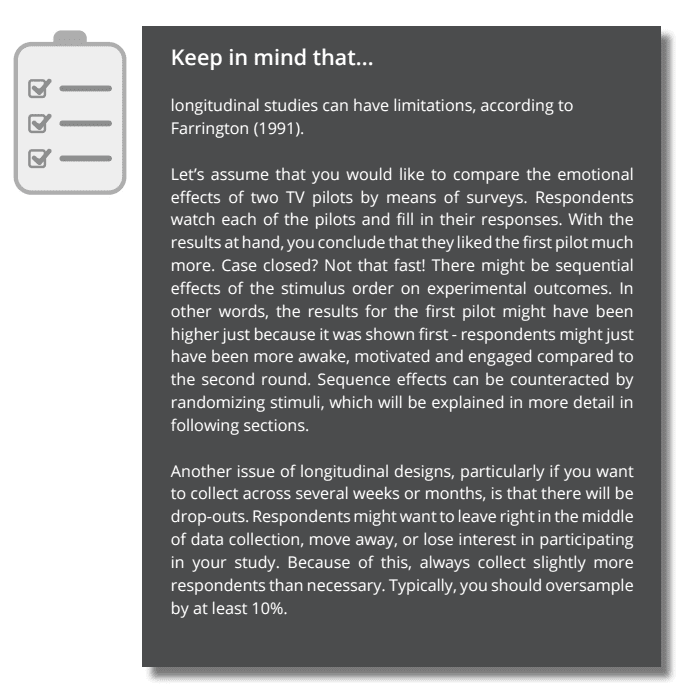
In a longitudinal study you conduct several observations of the same respondent group over time, lasting from hours to days, months and many years. By doing this, you establish a sequence of events and minimize the noise that could potentially affect each of the single measurements. In other words, you simply make the outcomes more robust against potential side effects.
For example, you could show a TV ad several times to your group of interest (male high-income shoppers) and see how their preference for the ad changes over time.
Other examples for longitudinal designs are:
- Media / package testing. Two or more media trailers or packages are shown in sequence to a group of respondents who evaluate how much they like each of the presented items.
- Food and flavor testing. Respondents are exposed to two or more flavors presented in sequence and asked for their feedback.
- UI and UX testing. Respondents navigate two or more websites and are interviewed with respect to usability questions.
- Psychology and Training. A group of respondents attending a professional training session answers a questionnaire on emotional well-being before, during and after training.
- Physiology. You monitor EEG, GSR, EMG, facial expressions, etc. while respondents are exposed to pictures, sounds or video stimuli.
The primary benefit of longitudinal designs is that you obtain a time-course of values within one group of respondents. Even if you only obtain cognitive-affective test scores before and after the experimental intervention, you are more likely to understand the impact of the intervention on already existing levels of attention, cognition or affect. Therefore, longitudinal studies are more likely to suggest cause-and-effect relationships than cross-sectional studies.
Mixed design
Mixed designs combine the best of two worlds as they allow you to collect longitudinal data across several groups. Strictly spoken, whenever you collect physiological data (like EEG, GSR, EMG, ECG, facial expressions, etc.) from several respondent groups in order to compare different populations, you have a mixed study design. The data itself is longitudinal (several samples over time), while the group comparison has cross-sectional aspects.
Typical examples for mixed designs are:
- Product / media testing. Two or more versions of a product or service are compared with respect to cognitive-behavioral outcomes of two or more groups (e.g., novices and experts, male and female, young and old).
- A-B testing. Two versions of a website or app are compared with respect to cognitive-behavioral outcomes of two or more groups.
Mixed design experiments are ideal for collecting time-courses across several groups of interest, allowing you to investigate the driving forces of human behavior in more detail than cross-sectional or longitudinal designs alone.
Ultimately, which design you choose is driven primarily by your research question. Of course, you can run a cross-sectional study first to get an idea of the potential factors affecting outcomes, and then do a more fine-grained longitudinal study to investigate cause and effect in more detail.
In the next section we will explain in more detail how stimuli should be arranged and which sensors are relevant.
Selecting and arranging stimuli
Experiments in human cognitive-behavior research typically involve some kind of stimulation used to evoke a reaction from respondents. The two most crucial stimulus-related questions are: Which stimuli do I need? In which sequence shall I present the stimuli?
Types of stimuli
Stimuli come in a range of modalities including audio, visual, haptic, olfactory etc. Multimodal stimuli combine several modalities. The following stimuli are used in academic and commercial research studies on human behavior:
- Images / pictures
- Video
- Websites
- Software interfaces
- Devices (car interieur, aircraft cockpit, milkshake machine etc.)
- Communication with others via phone, web or face-to-face
- Complex scenes (VR, real environments)
- Sound (sine waves, complex sound, spoken language, music)
- Olfaction (flavors, smells)
- Haptic stimuli (object exploration by touch, pressure plates, vibrating sensors, haptic robots)
- Questionnaires and surveys (web- or software-based, paper and pencil)
Stimulus sequence
Stimuli are generally presented to respondents in a specific sequence. What are typical sequences used in human cognitive-behavioral research?
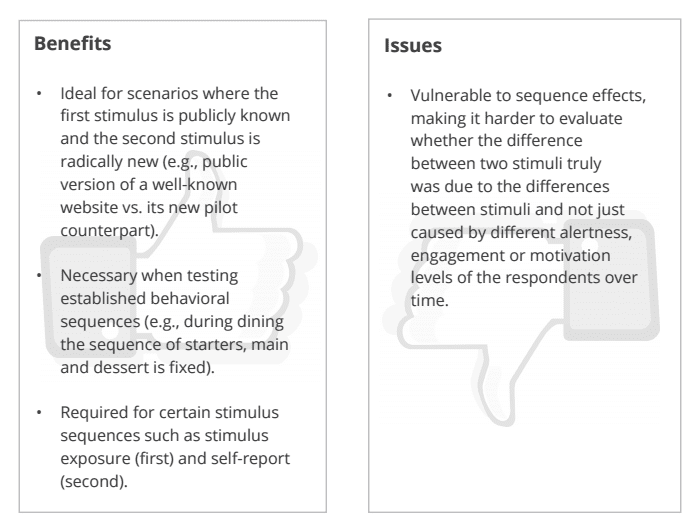
Fixed stimulus sequence
Fixed sequences are necessary whenever randomized sequences do not make sense or cannot be employed. For example, when combining a website test with a website-related interview it doesn’t make sense to ask website-related questions first and then tell the respondent to actually use the website.
Here, the only meaningful sequence is to do the website exploration first and the questionnaire second. When it comes to comparing different versions of a stimulus, for example, websites A and B, fixed sequences can also be used.
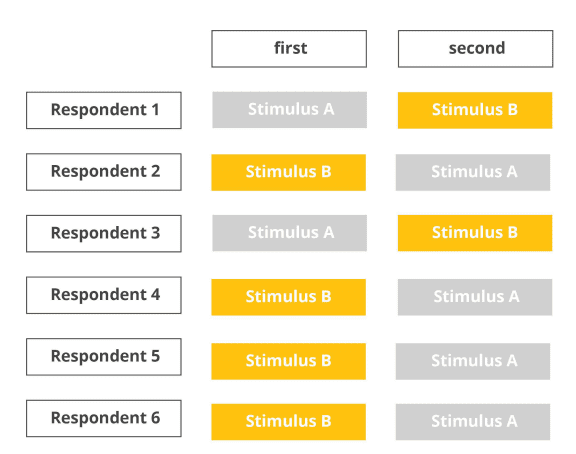
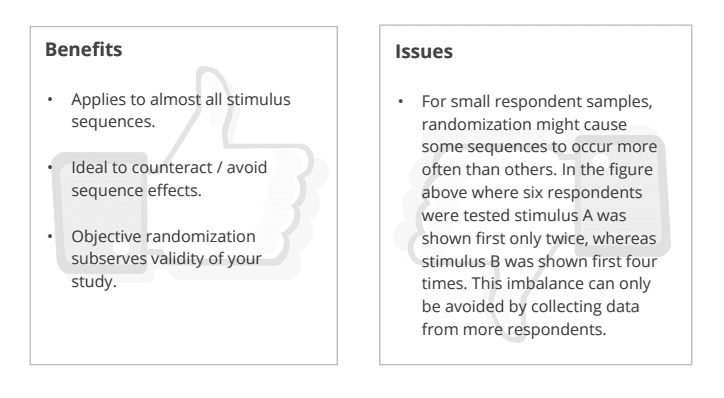
Random stimulus sequence
As you have learned before, presenting stimuli in the same sequence to all respondents bears the risk of sequential effects. Respondents might rate the first stimulus always higher because they are still motivated, engaged and curious.
After two long hours at the lab, exhaustion might take over, so ratings might be low even if the tested product or service exceeds all previous expectations. This can be avoided by presenting stimuli in random order.
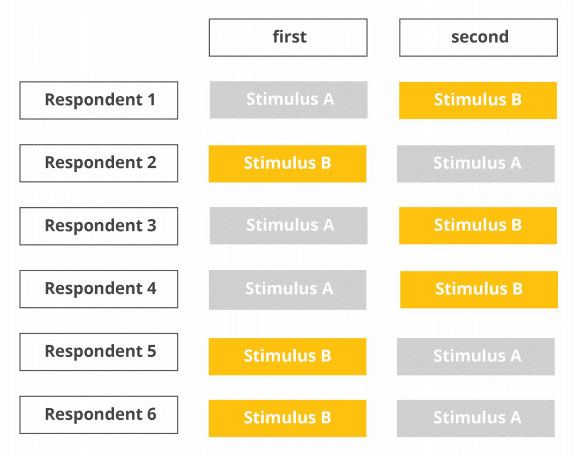
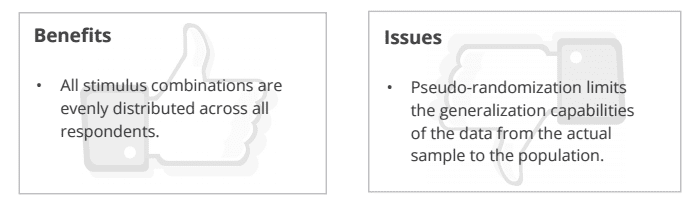
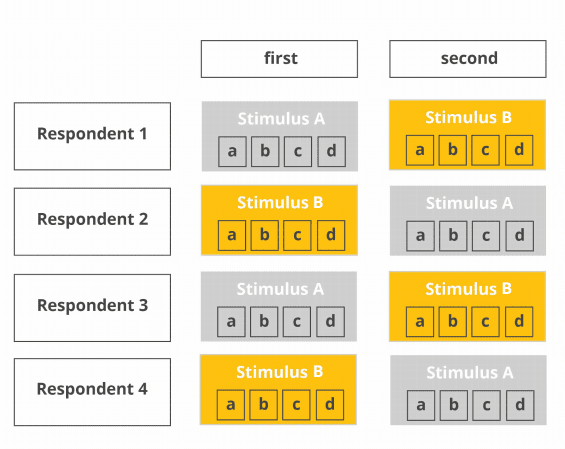
Counterbalanced sequence
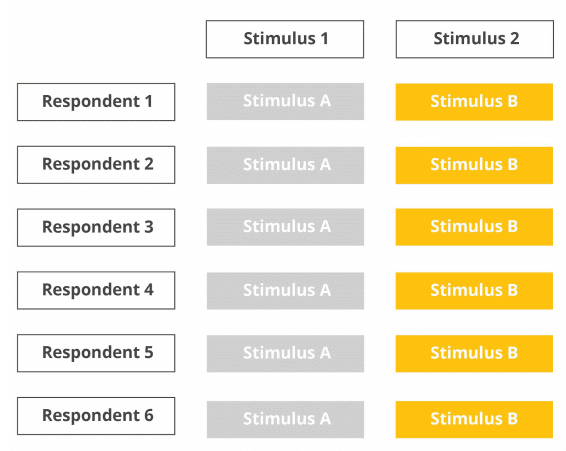
To avoid the issues of complete randomization, counterbalanced designs try to achieve an even distribution of conditions across the stimulus slots of the experiment. In the example below, two stimulus conditions A and B are counterbalanced across six respondents, so that three respondents are exposed to stimulus A first, and the other three respondents are exposed to stimulus B first.
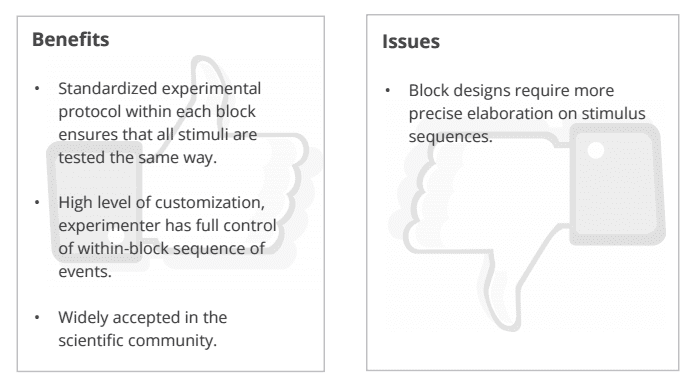
Block design
Sometimes it doesn’t make sense to randomize the entire stimulus list as there might be some internal logic and sequence. Let’s assume you would like to evaluate respondents’ behavior when unpacking several food packages.
For each package, there’s a fixed evaluation protocol where (a) the package is unveiled and (b) respondents are asked to describe their associations verbally. Then, (c) they should pick up the package and open it and (d) describe their experience. This sequence from step (a) to (d) can also be characterized as an experimental “block”, which is supposed to be repeated for all tested packages.
While the package presentation sequence is randomized, the content of each of the blocks stays the same.
Repeated design
EEG and other physiological recordings sometimes require repeated presentations of the same stimulus. This is necessary because the stimulus-driven changes in brain activity are much smaller compared to the ongoing activity. Presenting the same stimulus several times makes sure that enough data is present to get to valid conclusions.
However, stimulus repetition can also be done for eye tracking studies. In this case, the randomization procedures listed above apply as well.
You might be interested in the number of repetitions necessary to get to results. Unfortunately, this cannot be answered globally, as it depends on several factors such as magnitude of the expected effect/difference between two conditions, stimulus modality, physiological effect of interest, and other factors that take impact on experimental outcomes.
Also, there are strong statistical considerations which are beyond the scope of this general introduction.
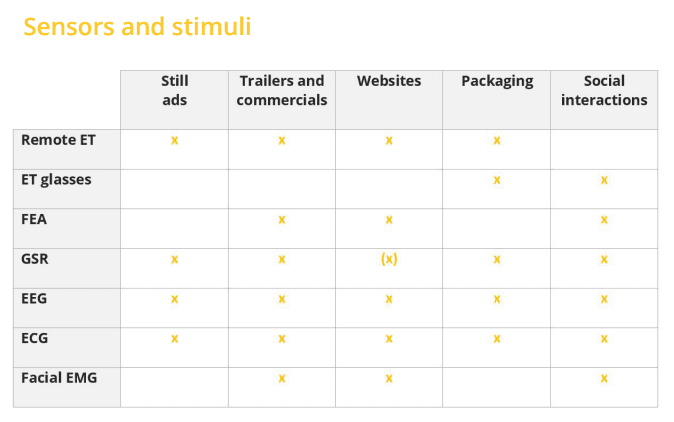
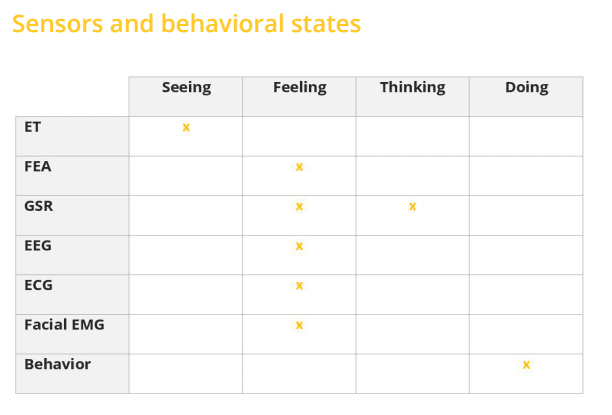
Modalities and sensors
Whenever you design experiments for human cognitive-behavior research, you certainly want to consider which biosensors you collect data from. Human behavior is a complex interplay of a variety of different processes, ranging from completely unconscious modulations of emotional reactions to decision-making based on conscious thoughts and cognition. In fact, each of our emotional and cognitive responses is driven by factors such as arousal, workload, and environmental conditions that impact our well-being in that very moment.
All of these aspects of human behavior can be captured by self-reports (via interviews or surveys), specific devices (such as eye trackers, EEG systems, GSR and ECG sensors) or camera-based facial expression analysis.
Eye Tracking
TV ads, video games, movies, websites, devices as well as social interaction partners in private life and in the workplace – we could process none of these without our vision. The human brain is fine-tuned for visual input and controlling eye movements. Therefore, it makes immediate sense to collect information on gaze position and pupil dilation from eye tracking. If you present visual stimuli on screen, you should always collect eye tracking data to be absolutely sure where respondents are directing their gaze to and how this is affecting cognitive processing. Second, monitoring pupil dilation can give valuable insights into arousal and stress levels of a respondent. As pupil dilation is an autonomic process, it cannot be controlled consciously. Eye tracking recordings allow you to monitor both respondents’ engagement and motivation as well as arousal levels during the encounter with emotional or cognitively challenging stimuli.
GSR/EDA
Galvanic skin response (GSR) or electrodermal activity (EDA) reflects the amount of sweat secretion from sweat glands in our skin. Increased sweating results in higher skin conductivity. When exposed to emotional content, we sweat emotionally. GSR recordings in conjunction with EEG are extremely powerful as skin conductance is controlled subconsciously, that is, by deeper and older brain structures than the cognitive processes that are monitored by EEG. Therefore, adding GSR offers tremendous insights into the unfiltered, unbiased emotional arousal of a respondent.
Facial Expression Analysis
With facial expression analysis you can assess if respondents are truly expressing their positive attitude in observable behavior. Facial expression analysis is a non-intrusive method to assess head position and orientation (so you always know where your respondents are positioned relative to the stimulus), expressions (such as lifting of the eyebrows or opening of the mouth) and global facial expressions of basic emotions (joy, anger, surprise etc.) using a webcam placed in front of the respondent. Facial data is extremely helpful to monitor engagement, frustration or drowsiness.
(facial) EMG
Electromyographic sensors monitor the electric energy generated by body movements. EMG sensors can be used to monitor muscular responses of the face, hands or fingers in response to any type of stimulus material. Even subtle activation patterns associated with consciously controlled hand/finger movements (startle reflex) can be assessed with EMG. Collecting synchronized EMG data is relevant for anyone interested in how movements of the eyes and limbs are prepared and executed, but also how movements are prevented and actions are inhibited.
ECG/PPG
Monitoring heart activity with ECG electrodes attached to the chest or optical heart rate sensors attached to finger tips allows you to track respondents’ physical state, their anxiety and stress levels (arousal), and how changes in physiological state relate to their actions and decisions. Tracking respondents’ physical exhaustion with ECG sensors can provide helpful insights into cognitive-affective processes under bodily straining activity.
EEG
Electroencephalography (EEG) is a neuroimaging technique measuring electrical activity generated by the brain from the scalp surface using portable sensors and amplifier systems. It undoubtedly is your means of choice when it comes to assess brain activity associated with perception, cognitive behavior, and emotional processes. EEG reveals substantial insights into sub-second brain dynamics of engagement, motivation, frustration, cognitive workload, and further metrics associated with stimulus processing, action preparation, and execution. Simply put: EEG impressively tells which parts of the brain are active while we perform a task or are exposed to certain stimulus material.
Self-reports
Any experiment should contain self-reported data collection stages, for example at the beginning of the session, during data collection, and at the very end. Gathering demographic data (gender, age, socio-economical status, etc.) helps describing the respondent group in more detail. Also, self-reported data from interviews and surveys helps tremendously to gain insights into the subjective world of the respondents – their self-perceived levels of attention, motivation and engagement – beyond quantitative values reported by biosensors. Of course, survey results can be utilized to segment your respondents into specific groups for analysis (e.g., young vs. old; male vs. female; novice vs. experienced users).
Experimental design done right with iMotions
Properly designed experiments allow you deep insights into attention, cognition and emotional processing of your desired target population when confronted with physical objects or stimuli. Experimental research has come up with dedicated recommendations on how to prevent experimenter or segmentation bias – randomization strategies for respondent and stimulus selection are an excellent starting point.
Before you get started designing your next human cognitive-behavioral experiment, you certainly want to think about how to arrange stimuli, how to select respondents and which biosensors to use in order to gain maximum insights.
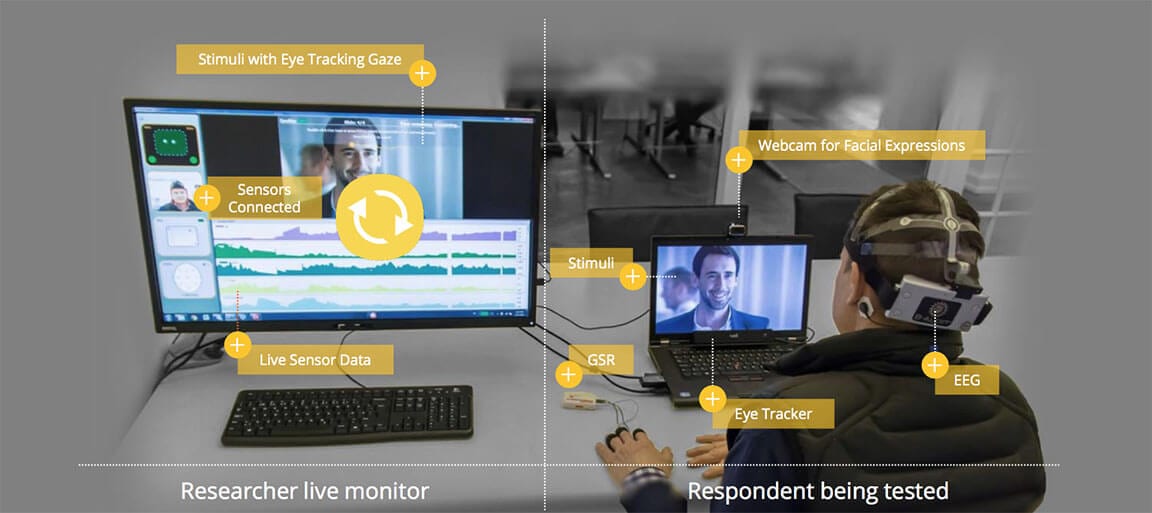
What if there was a multimodal software solution that allows for loading and arranging any type of stimuli, for example, in fixed or randomized sequences, while recording data from EEG, eye tracking, facial expression analysis and other biosensors (such as GSR, ECG, EMG) without having to manually piece everything together?
The iMotions Platform
The iMotions Platform is one easy-to-use software solution for study design, multi-sensor calibration, data collection, and analysis.
Out of the box, iMotions supports over 50 leading biosensors including facial expression analysis, GSR, eye tracking, EEG, ECG, and EMG, as well as surveys for multimodal human behavior research.
Free 44-page Experimental Design Guide
For Beginners and Intermediates
- Introduction to experimental methods
- Respondent management with groups and populations
- How to set up stimulus selection and arrangement
References
- Banerjee, Chaudhury, et al. (2007). Statistics without tears – inputs for sample size calculations. Indian Psychiatry Journal, 16, 150–152.
- Banerjee & Chaudhury (2010). Statistics without tears: Populations and samples. Industrial Psychiatry Journal, 19(1), 60–65.
- Creative Research Systems (2003). Sample Size Calculator. Retrieved from https://www.surveysystem.com/sscalc.htm on 2016-08-06.
- Cooper, Camic et al. (2012). APA handbook of research methods in psychology, Vol 1: Foundations, planning, measures, and psychometrics.
- Cooper, Camic et al. (2012). APA handbook of research methods in psychology, Vol 2: Research designs: Quantitative, qualitative, neuropsychological, and biological.
- Farrington (1991). Longitudinal research strategies: advantages, problems, and prospects. Journal of the American Academy of Child and Adolescent Psychiatry, 30(3), 369–374.
- Hofling et al. (1966). An experimental study of nurse-physician relationships“. Journal of Nervous and Mental Disease, 143, pp. 171-180.
- McLeod (2007). The Milgram Experiment. Retrieved from www.simplypsychology.org/milgram.html on 2016-07-31.
- Martinez-Mesa, Gonzalez-Chica et al. (2014). Sample size: How many participants do need in my research? Anais Brasileiros de Dermatologia, 89(4), 609–615.
- Monahan & Fisher (2010). Benefits of observer effects: Lessons from the field Qualitative Research, 10(1), pp. 357-376.
- Niles (2014). Sample size: How many survey participants do I need ? Retrieved from https://www.sciencebuddies.org/science-fair-projects/project_ideas/Soc_participants.shtml on 2016-08-06
- Ryan (2006). Modern Experimental Design (2nd edition). New York: Wiley Interscience.