Electrodermal activity (EDA) is a robust indicator of underlying emotional arousal within human behavior research. EDA (often also referred to as galvanic skin response, or GSR) reflects activity of the sympathetic nervous system – the activity of which is dependent on physiological and emotional activation.
There are a number of key output measures derived from EDA signals depending on your specific research question. Indeed, it is always important to first consider what output measures you are interested in and what analyses you will be conducting before beginning data collection. As such, this post covers a high level overview of one such well-standardized EDA output measure – peak detection.
EDA Component Overview and SCRs
It is important to first review the underlying components of EDA before diving into the specifics of how to conduct peak detection analyses. EDA measures skin conductance derived from microscopic changes in the level of perspiration on the surface of the skin [1]. Sweat secretion is involved in a number of regulatory processes [4], and an abundance of research suggests that skin conductance responses (SCR) are associated with emotional arousal [4-7].
Detection of SCRs are a result of the fluctuation of two underlying components of EDA activity: the slow and steady baseline tonic component, and the faster or reactive phasic component. Sudden shifts in phasic activity above tonic activity are known as EDA Peaks.
When these peaks occur in response to stimuli, they are known as Event-Related Skin Conductance Responses (ER-SCR). When these peaks do not appear to be related to the presentation of a stimulus, they are referred to as Nonspecific Skin Conductance Responses (NS-SCR) [1, 6].
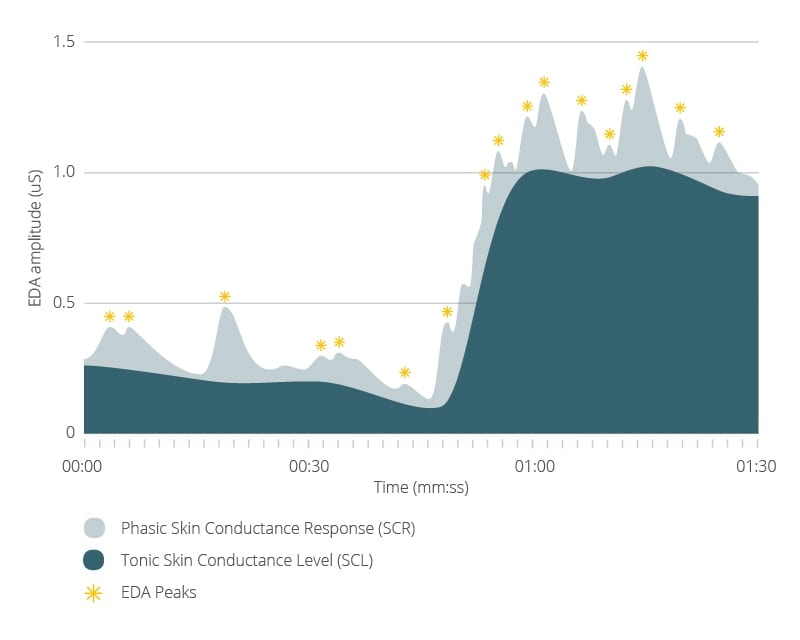
Assessing the number of EDA peaks provides quantitative input into the level of emotional arousal or intensity during an experimental session.
How to detect EDA peaks
A number of signal processing steps are required to derive EDA Peaks. The steps outlined below are based off standardized methods [4, 9-11] and can be conducted via the signal processing toolbox of your choice. iMotions provides an EDA Peak Detection Signal Processing flow via an R Notebook directly in the software using the steps outlined below
Get calibrated EDA signal into the signal processing toolbox of your choice
a. This value depends on the EDA device you are using – the iMotions R Notebook detects this for any integrated device.
b. Other tools such as Ledalab, custom scripts built in MatLab, Python, or other signal processing systems can also be used.
Determine the sample rate of the signal
Extract Phasic Data from original EDA signal using a median filter
The phasic signal is extracted from the original EDA signal using a median filter over a fixed length window (typically 8000 ms).
Apply a low-pass Butterworth Filter on the phasic data to remove line noise
This filters out noisy components of the EDA signal. A cutoff frequency of 5Hz is typically used.
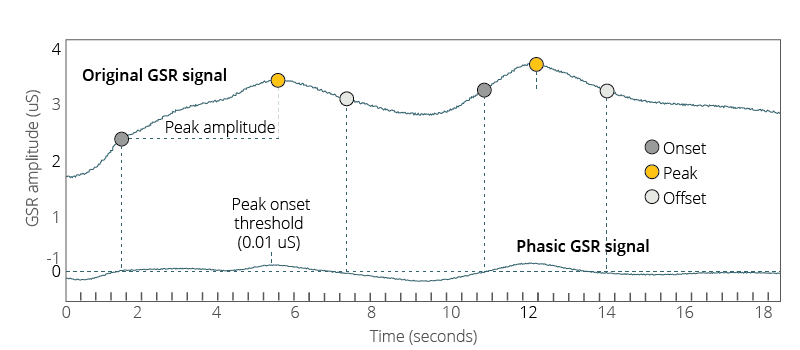
Identify onset and offsets
a. Identify the peak onset and offset values to define where the signal processing tool will look for the peaks.
b. Onsets are all points in which the phasic signal crosses above the onset threshold (typically > 0.01 uS).
c. Offsets are all points in which the phasic signal crosses below the offset threshold (typically < 0 uS)
Define the peak amplitude threshold
a. Find the maximum amplitude value within each onset-offset window.
b. Subtract the amplitude value at onset from the max amplitude.
c. Identify the peak amplitude threshold (typically .005). Values are only considered possible peaks if they cross the peak amplitude threshold value above the amplitude value at onset.
Identify the Signal Jump Threshold
a. Here, you identify a threshold of 0.1 uS between signals to look for a substantial ‘signal jump’.
b. These jumps may represent false positive peaks from movement artifacts otherwise not picked up by filters.
c. A possible peak is only selected if:
Its amplitude is above the amplitude threshold (0.005 uS), and
the time difference between onset and offset is above the duration threshold (500 ms).
Bin data (assign data to a virtual time bin)
Interpretation of EDA Peaks
Now that you have derived EDA Peaks for your study, it is important that you are able to interpret them accordingly. Remember that EDA Activity can reflect emotional intensity and the number of EDA peaks can give you an index of how emotionally evoking certain stimuli are for participants.
Research on stress reactivity suggests that more EDA peaks are detected during stressful situations than during non-stressful situations [7, 12, 13]. The EDA peaks are reflective of the greater emotional arousal experienced during stress. It is however important to note that while more EDA peaks indicate greater emotional intensity, the direction of this emotion (valence) can not be derived from EDA alone.
For example, individuals who have a preference for public speaking may show increased EDA activity in anticipation of and during a speaking event, but may also report a more positive or excitable affect. Conversely, individuals who dislike public speaking may also show increased EDA activity during a speaking event but report negative emotions in response to the task [12]. The EDA signal is therefore not representative of the type of emotion, but simply the intensity of it.
As such, a multi-modal approach pairing EDA with tools that assess emotional valence (e.g. self report and automated facial coding) can ultimately provide you with deeper insights into both emotional intensity and valence.
If you’d like to learn more about how to use EDA in your research, download our free pocket guide below.
Free 36-page EDA/GSR Guide
For Beginners and Intermediates
- Get a thorough understanding of all aspects
- Valuable GSR research insights
- Learn how to take your research to the next level

References
[1] Boucsein, W. (2012). Electrodermal Activity. New York, Berlin: Springer, 2nd edition
[2] Wenger CB. Thermoregulation. In: Freedberg IM, Eisen AZ, Wolff K, Austen KF, Goldsmith LA, Katz SI, editors. Dermatology in general medicine, 1. New York: McGraw-Hill; 2003. p. 119–27.
[3] Critchley, H. (2002). Review: Electrodermal Responses: What Happens in the Brain. The Neuroscientist, 8(2), pp.132-142.
[4] Fowles DC, Christie MJ, Edelberg R, Grings WW, Lykken DT, Venables PH. Publication recommendations for electrodermal measurements. Psychophysiology, 1981;18(3):232–9.
[5] Anders, S., Lotze, M., Erb, M., Grodd, W. and Birbaumer, N. (2004). Brain activity underlying emotional valence and arousal: A response-related fMRI study. Human Brain Mapping, 23(4), pp.200-209.
[6] Dawson, M., Schell, A., & Filion, D. (2000). The electrodermal system. In J. T. Cacioppo, L. G. Tassinary, and G.B. Bernston, Handbook of Psychophysiology: second edition, pages 200–223. Cambridge Press, Cambridge, 2000.
[7] Bakker, J., Pechenizkiy, M., & Sidorova, N. (2011). What’s your current stress level? Detection of stress patterns from GSR sensor data. In Proceedings – IEEE International Conference on Data Mining, ICDM (pp. 573–580). doi:10.1109/ICDMW.2011.178
[8] Guo, R., Li, S., He, L., Gao, W., Qi, H., & Owens, G. (2013). Pervasive and Unobtrusive Emotion Sensing for Human Mental Health. Proceedings of the ICTs for Improving Patients Rehabilitation Research Techniques, 436–439. doi:10.4108/icst.pervasivehealth.2013.252133
[9] Benedek, M., & Kaernbach, C. (2010). Decomposition of skin conductance data by means of nonnegative deconvolution. Psychophysiology, 47, 647–658. doi:10.1111/j.1469-8986.2009.00972.x
[10] Benedek, M., & Kaernbach, C. (2010). A continuous measure of phasic electrodermal activity. Journal of Neuroscience Methods, 190, 80–91. doi:10.1016/j.jneumeth.2010.04.028
[11] Greco, A., Valenza, G., & Scilingo, E. (2016) Advances in Electrodermal Activity Processing with Applications for Mental Health: From Heuristic Methods to Convex Optimization. Switzerland. Springer.
[12] Tomaka, J., Blascovich, J., Kelsey, R.M. (1993). Subjective, physiological, and behavioral effects of threat and challenge appraisal. Journal of Personality and So⁃ cial Psychology, vol. 65, no. 2, pp. 248-260. doi: 10.1037/0022⁃3514.65. 2.248.
[13] Bradley, M., & Lang, P., (2000). Measuring emotion: Behavior, feeling and physiology. In Cognitive Neuroscience of Emotion, R. Lane and L. Nadel Eds. New York, USA: Oxford University Press, 2000, pp. 242-276.