Explore the fundamentals of EEG in 5 Basics of EEG 101, covering essential aspects of data collection, processing, and analysis. This comprehensive guide provides insights for researchers and practitioners in the field of neuroscience.
Table of Contents
When it comes to the analysis of EEG data, you might easily feel overwhelmed by the huge variety of pre-processing steps all of which require informed decisions with regard to the expected effects on the data.
In this blog post, we would like to shed some light on 5 key aspects that are crucial for EEG data processing.
1) Run pilots
EEG experiments require careful preparation. You need to prepare the participants, spend some time on setting up the equipment and run initial tests. You certainly do not want your EEG experiment to fail mid-test, so before carrying out a full study with 100 participants start small and run some pilot sessions in order to check if everything is working properly.
- Are the stimuli presented in the right order?
- Are mouse and keyboard up and running?
- Do participants understand the instructions?
- Do you receive signals?
Once you have crossed those questions off your list, you are all set to start with the actual data collection and analysis.
2) “There is no substitute for clean data”
Wise words of Prof. Steve Luck (UC Irvine) that you should keep in mind whenever you record and pre-process EEG data in order to extract metrics of interest.
To this day, there is no algorithm that is able to decontaminate poorly recorded data, and you simply cannot clean up or process data in a way that magically alters the signal. Therefore, always start with properly recorded data.
EEG systems generally offer soft- or hardware-based quality indicators such as impedance panels where the impedance of each electrode is visualized graphically.
Low impedance values imply high recording quality (low impedances indicate that the recorded signal reflects the processes inside of the head rather than artifactual processes from the surroundings).
Clean data allows clean responses to your research questions!
3) Make informed decisions
EEG data can be recorded and analyzed in a lot of different ways, and not only the processing steps themselves but also their sequence matters (One example of the significance of pre-processing steps’ sequence is described in Bigdely-Shamlo et al., 2015). All signal processing techniques alter the data to some extent and being aware of their impact on the data definitely helps to pick the right ones.
The phrase “making informed decisions” is the key – if you are hesitant about which methods to choose, check out well cited existing literature. Most certainly, you will find valuable advice in scientific research papers or even in the “lab traditions” of your team.
By making sure that the methods of choice return the desired outcomes, you are able to maximize scientific research standards such as objectivity, reliability, and validity. You can check this by visualizing the returned results in the software where you run your analysis, after altering corresponding preprocessing steps or parameters.
Suggested pipeline for time-frequency analysis:

4) Attenuate or reject artifacts
EEG data contains relevant and irrelevant aspects. For example, one might be interested in event-related potentials time-locked to the onset of a specific visual stimulus. If the participant blinks at that very moment, the EEG might not reflect the cortical processes of seeing the stimulus on screen.
As an EEG expert, you might tend to exclude this trial from the analysis since the EEG data does not contain relevant information. However, if blinking occurs systematically during stimulus onset throughout the experiment, this might tell an interesting story.
Maybe the participant avoids seeing a potentially threatening picture. Rejecting all trials where blinks occur basically results in a drastic reduction of data (it very well could happen that only 10 trials out of 100 are left – imagine this!).
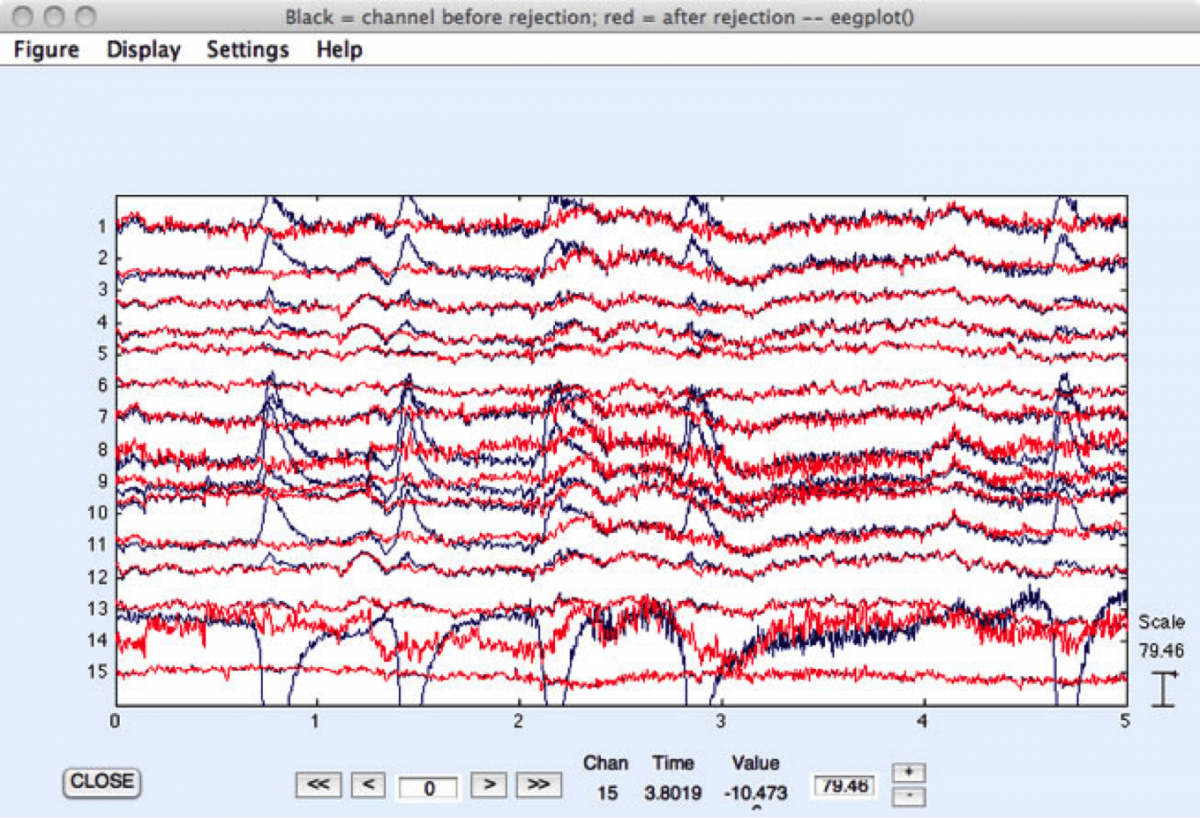
Therefore, attenuation procedures based on statistical procedures such as regression or interpolation or Independent Component Analysis might be more appropriate. In this case, contaminated data portions are replaced with interpolated data using surrounding data channels or time points (in the image below the red lines represent the corrected signal).
Unfortunately, the discussion on whether artifacts should be attenuated or rejected is ongoing in the scientific community, and you might have to evaluate which procedures return the desired output signal of interest.
However, combining scalp EEG with other sensors such as eye trackers, EMG, or ECG electrodes helps to collect physiological processes such as blinks and muscle movements of limbs or the heart through other modalities, making it easier to identify their intrusion into the EEG data.
5) Go for the right statistics
When designing and analyzing an EEG experiment, it is always recommendable to base your procedures on known material. You certainly will find it easier to explain the observed effects if you are able to link your results to well cited existing publications where a comparable statistical procedure has been used.
As mentioned above, making informed decisions also applies in the context of selecting the right statistical procedures. In case you intend to investigate event-related potentials (ERPs), you might want to have a closer look into the latencies and amplitudes of the peaks in the ERP waveforms at certain electrode locations.
By contrast, if you are interested in frequency-based measures such as theta, alpha, beta band power, you rather focus on the examination of the peak frequency or summed power within the band of interest (see here for more information on iMotions EEG Power Spectral Density Analysis Tool – EEG R Notebooks).
EEG metrics such as “Workload” (Advanced Brain Monitoring B-Alert) or “Focus” (Emotiv EPOC) are either premised on time- or frequency-domain features of the EEG data, and can also be analyzed in view of peak amplitudes or latencies with respect to the onset of a certain event.
Analysis techniques can comprise simple t-tests and more complex ANOVAs (Analysis of Variance) as well as non-parametric procedures such as bootstrapping or randomization techniques. But pick carefully beforehands based on your context, research purpose etc.

Fortunately, the complexity of running and analyzing EEG experiments can be significantly simplified by piloting, collecting clean data, and making informed decisions along the way of pre-processing and statistically analyzing the data.
Do not hesitate to talk to us here at iMotions if you would like to enrich your research endeavor with EEG and other physiological sensors. We will be happy to provide you with the necessary tools and information to get you started with the collection of high-quality data in no time! Contact us here
Continue to read here for information about academic research or commercial research!
Frequently Asked Questions
What is EEG data?
EEG (Electroencephalogram) data refers to the electrical activity of the brain recorded over a specific period. This activity is captured using electrodes placed on the scalp, which detect the minute electrical changes resulting from the synchronized activity of neural assemblies. EEG data can provide insights into different states of consciousness, cognitive processes, and potential neurological abnormalities.
Who analyzes EEG results?
EEG results are typically analyzed by neurologists or specially trained EEG technologists. In clinical settings, a neurologist interprets the data to diagnose or monitor neurological conditions like epilepsy, sleep disorders, or other brain-related issues. In research settings, neuroscientists, psychologists, or other specialized researchers may analyze EEG data to study brain function, cognition, or behavior.
For these dedicated professionals and aspiring students, continuous learning and access to foundational knowledge are paramount. To deepen your understanding and ensure you have the best resources at hand, explore our guide to essential EEG books.
How is EEG data presented?
EEG data is typically presented as a series of waveforms on a graph, where the x-axis represents time, and the y-axis represents the voltage or amplitude of brainwaves. These waveforms can vary in frequency and amplitude, and different patterns can be associated with specific brain states or activities.
The data might be displayed as raw waveforms, or it can be processed to highlight specific frequencies or patterns. Additionally, in some advanced presentations, EEG data can be combined with imaging techniques to create brain maps that highlight activity in different regions.
Final Thoughts
Analyzing EEG data can be a daunting task given the multitude of pre-processing steps involved. The article highlights 5 key aspects essential for EEG data processing:
Run pilots: Before launching a full-scale EEG study, it’s imperative to conduct pilot sessions to test the system, ensure the stimuli are presented correctly, and verify that participants comprehend the instructions.
“There is no substitute for clean data”: Emphasizing the words of Prof. Steve Luck from UC Irvine, the article underscores the importance of quality data collection. No technology or algorithm can salvage poorly recorded data, making it critical to start with accurate data recordings. Systems usually come with indicators, like impedance panels, to visualize data quality.
Make informed decisions: The way EEG data is recorded and analyzed can differ, and the order of processing steps can impact the outcome. Familiarizing oneself with the impacts of different processing techniques and referencing existing literature can guide informed decision-making.
Attenuate or reject artifacts: EEG data often contains irrelevant data or ‘noise’. For instance, a blink during a stimulus presentation can disrupt data. The article delves into the ongoing debate about whether to attenuate (correct) or reject such artifacts. It also touches on the advantage of using other sensors like eye trackers and ECG electrodes to pinpoint potential disruptions in EEG data.
Go for the right statistics: Building analyses based on existing literature can aid in understanding observed effects. The choice of statistical procedures depends on the objective of the study, whether it’s event-related potentials or frequency-based measures. Various analytical techniques are available, ranging from simple t-tests to more complex procedures.
Free 59-page EEG Guide
For Beginners and Intermediates
- Get a thorough understanding of the essentials
- Valuable EEG research insight
- Learn how to take your research to the next level

Psychology Research with iMotions
The world’s leading human behavior software


![Featured image for How to Set Up a Cutting-Edge Research Lab [Steps and Examples]](https://imotions.com/wp-content/uploads/2023/01/playing-chess-against-robot-300x168.webp)