Multimodal Solution with iMotions
Understanding human behavior requires examining the physiological responses that drive it. One of the most effective ways to do this is by using advanced hardware and software designed to measure specific physiological responses. These tools provide accurate data that offer insights into the complex relationship between physiological states and behavior.
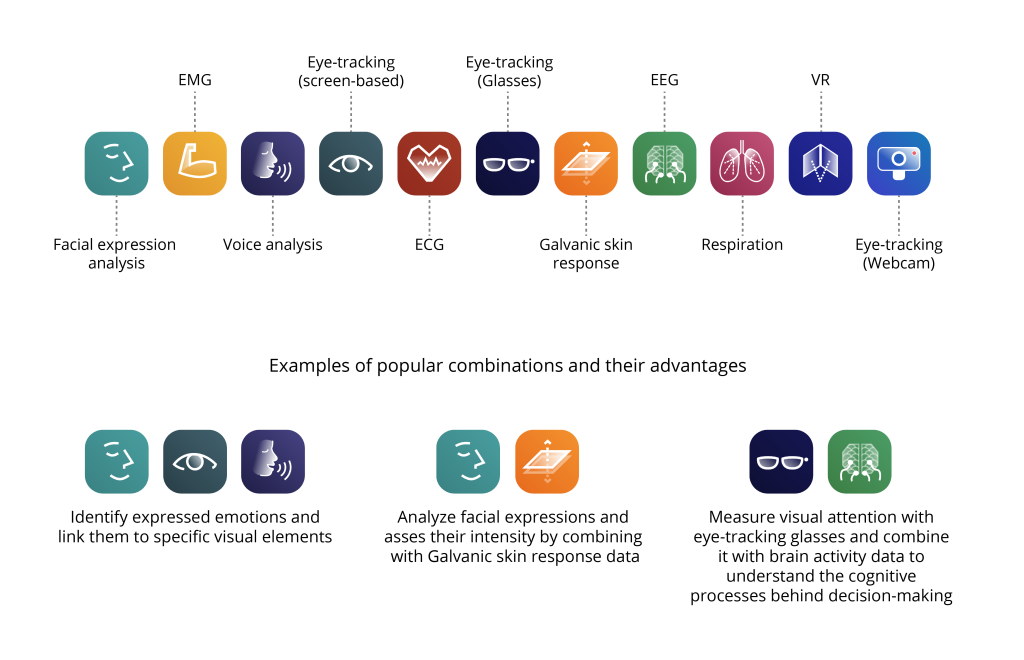
In a basic study, a single biosensor might be used to explore a question like which design elements attract attention, what emotions arise during a video, or how heart rate changes under stress. While informative, these studies often lack a complete view of behavior. For instance, knowing where someone looks doesn’t reveal their emotional state, and understanding their feelings doesn’t explain the trigger. Using multiple biosensors can offer a fuller picture. However, multiple sensors also complicate the setup, requiring multiple computers and manual data synchronization, which is time-consuming and complex.
With iMotions, these obstacles are solved by creating a unified research lab setup. Our software allows for the synchronization of multiple hardware measurements using a single computer, streamlining the process and enhancing efficiency.

Align Multiple Data Sources in One Platform
Our software consists of an essential core module that contains the central framework supporting the entire system and acts as the analytical engine. With the core module you purchase biosensor modules based on your research question.
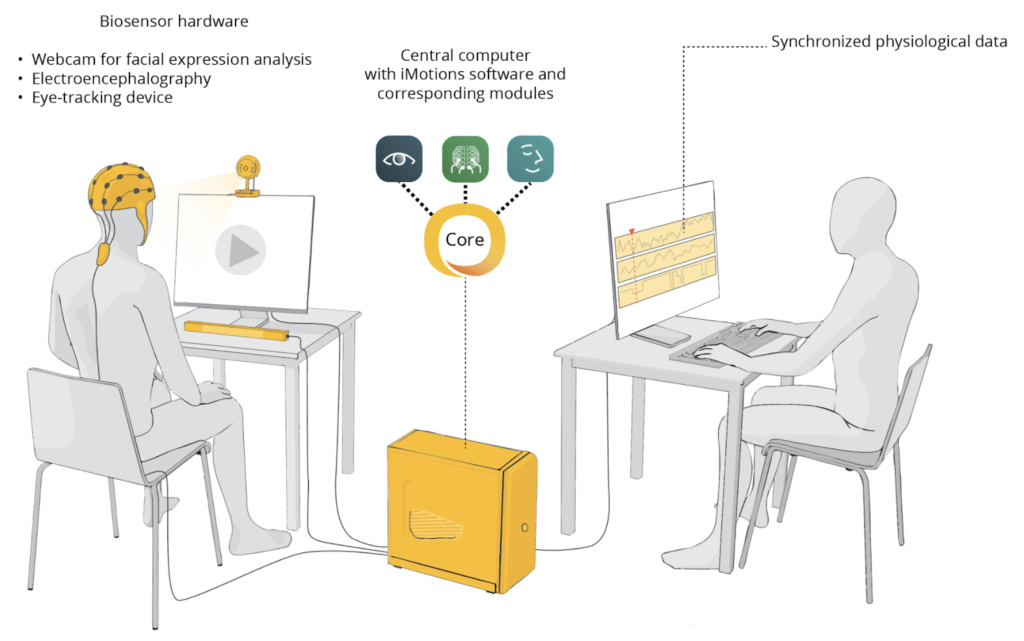
To illustrate a typical lab setup, consider a hypothetical study where you want to examine the influence of a specific video on human physiology. Specifically, you aim to measure attention using eye tracking, analyze emotions using facial expression analysis (FEA), and measure brain activity using encephalography (EEG).

In this scenario, you can use a single computer equipped with iMotions software, which includes the core module along with three additional modules for eye tracking, facial expression analysis (FEA), and EEG to analyze brain activity. Typically, the computer will have two monitors connected-one for presenting the stimulus to the participant and one for the researcher to oversee the study. Your hardware is connected to the computer and subsequently paired within the iMotions software. During the study, the participant watches the video while the software collects the physiological data. This streamlined setup ensures that all data is accurately aligned, enabling comprehensive analysis of the physiological responses to the video. Needless to say, you have always options to plug in additional sensors after acquiring the corresponding modules.
iMotions software helps you with analyses
After completing your measurements and collecting data, the next step is to export the data. You have three options for exporting: raw sensor data, processed sensor data provided by the hardware, and processed sensor data provided by iMotions’ signal processing algorithms, known as R-notebooks.
Our R-notebooks contain open algorithms that help extract valuable metrics from raw data. For instance, from a raw ECG recording, you can directly extract metrics such as heart rate and heart rate variability, which are directly related to physiological responses such as stress levels, relaxation states, and overall cardiovascular health. Currently we offer more than fifteen R-notebooks representing the most frequent needs for analysis needed in both academia and the private sector. This enables a more versatile, prompt and standardized analysis of your data.

Needless to say, through all the steps, we are here to offer you help when needed. From the earliest stages of designing the study and recommending compatible hardware, to providing support with data collection, analysis, and interpretation, our team is dedicated to ensuring your research success. Whether you need technical assistance or guidance on best practices, we are committed to being your reliable partner throughout the entire research process.
iMotions Software Products
Full-scale human behavior
research solutions
A software research suite that integrates an ecosystem of virtually any biosensor technology to provide the most robust data and insights available.


