The Stroop Effect is a widely studied phenomenon showcasing the interference between reading words and identifying colors. This article delves into the mechanism behind this cognitive process, explaining why the brain struggles with conflicting information. Understanding the Stroop Effect sheds light on the complexities of human cognition and perception.
Table of Contents
To see and interact with the world, we first need to understand it. Visual processing is one way we do this, and is composed of many parts. When we see an object, we don’t just see its physical attributes, we also comprehend the meaning behind them. We know that a chair needs legs because the seat needs to be raised, we know that the wood comes from trees, we know we could sit in it, and so on. There is information that we process about the things we see without even being aware of that processing.
So when John Ridley Stroop asked people to read words on a sheet of paper in 1929, he knew that their automatic processing would come into play, and could offer a breakthrough insight into brain function. Research from as early as 1894 had shown that associations of even nonsense syllables would become embedded into a person’s understanding, and could interfere with how they processed and recalled these syllables, despite no real meaning being attached to them. It was therefore clear, even in the beginnings of contemporary psychological research, that associations are powerful and pervasive.
The History and Origin of the Stroop Effect
The Stroop Effect[1] represents a fascinating phenomenon in the psychology of perception and cognition, showcasing the complex interplay between automatic and controlled processing mechanisms within the human brain. Its discovery is credited to John Ridley Stroop, who first documented the effect in his Ph.D. dissertation at George Peabody College in 1935, later published as “Studies of interference in serial verbal reactions” in the Journal of Experimental Psychology[2].
The foundational experiment that Stroop conducted involved presenting subjects with lists of words. These words were colors printed in an ink that either matched or conflicted with the color name (e.g., the word “red” printed in red versus the word “red” printed in blue). Stroop observed that participants took longer to name the color of the ink when the color of the ink and the word itself were incongruent. This delay, now known as the Stroop effect, highlighted the cognitive conflict between the more automatic process of reading the word and the more controlled process of recognizing the color of the ink.
Stroop’s work built upon earlier research into color naming and reading speed, but his experiments uniquely quantified how automatic reading could interfere with a task that required control over this automatic process. The significance of the Stroop effect lies not just in its demonstration of the interference phenomenon but also in its insight into the architecture of the human mind, suggesting that certain cognitive processes are more automatic and thus more difficult to suppress or modify.
Over the decades, the Stroop effect has been extensively replicated and has served as a foundation for numerous psychological studies. It has been used to explore attention, processing speed, cognitive control, and the neural mechanisms underlying these processes. The simplicity of the Stroop task, combined with its robustness, has made it a cornerstone in cognitive psychology and neuroscience[3], providing insights into the workings of the human brain and the nature of human cognition[4].
What is the Stroop Effect?
Stroop’s innovation was to show, clearly and definitively, that our embedded knowledge about our environment impacts how we interact with it. His research method is now one of the most famous and well-known examples of a psychological test, and is elegant in its simplicity.
First, the participant reads a list of words for colors, but the words are printed in a color different to the word itself. For example, the word “orange” would be listed as text, but printed in green. The participant’s reading time of the words on the list is then recorded. Next, the participant has to repeat the test with a new list of words, but should name the colors that the words are printed in. So, when the word “orange” is printed in green, the participant should say “green” and move on to the next word.
The Stroop Test
Below is a brief example of the Stroop test, try it out!
First, time yourself while you read the following text, ignoring the colors the words are printed in.
BLUE ORANGE YELLOW RED PURPLE
PINK BLUE BLACK PURPLE GREEN
ORANGE BLACK YELLOW PINK RED
BLUE PINK ORANGE BLACK BLUE
Now time yourself while you state the colors of the following words, ignoring the actual text (as best as you can!).
YELLOW RED PINK BLUE GREEN
PURPLE YELLOW BLUE BLACK PINK
BLUE RED GREEN ORANGE PINK
BLACK RED YELLOW PURPLE BLUE
In most cases, it takes longer to state the colors of the words, rather than to read the text they are printed in, despite the incongruence being essentially the same across both lists (i.e. both show words in the wrong color). It appears we are more influenced by the physical text than than the text color.
The Stroop test is difficult to perform because it creates a conflict between the automatic processing of reading words and the intentional processing of identifying colors. This conflict leads to interference, resulting in longer response times and increased errors. Our brain’s tendency to prioritize word reading over color naming makes it challenging to accurately and quickly identify the colors of the words.
Why does this happen?
What this reveals is that the brain can’t help but read. As habitual readers, we encounter and comprehend words on such a persistent basis that the reading occurs almost effortlessly, whereas declaration of a color requires more cognitive effort. When there is a conflict between these two sources of information, our cognitive load is increased, and our brains have to work harder to resolve the required difference. Performing these tasks (preventing reading, processing word color, and resolving information conflict) ultimately slows down our responses, and makes the task take longer.
There are a few theories that slightly differ in their definitions of the Stroop Effect, yet their differences mostly lie in which part that they emphasize. For example, one theory emphasizes that the automaticity of reading as the principal cause of Stroop interference, while another emphasizes the mental prioritizing which we perform when reading, as compared to defining colors. While differences in theories may therefore exist, all essentially converge on the central premise that reading is a simpler and more automatic task than stating colors, and that a conflict between the two will increase the time needed for processing.
There are several theories regarding the Stroop Effect, each with its own emphasis. One theory highlights the automaticity of reading as the main cause of interference[9], which is the interpretation that John Ridley Stroop also supported, while another focuses on the mental prioritization involved in reading versus identifying colors[10]. Despite these variations, all theories agree that the conflict between reading and color identification leads to slower processing and increased task duration.
The Neural Mechanisms Underlying the Stroop Effect
The Stroop effect intricately illustrates the neural complexity of cognitive processes, such as attention, memory, and control mechanisms within the human brain. The neural basis of the Stroop[5] effect has been extensively studied using various neuroimaging techniques, including functional magnetic resonance imaging (fMRI) and positron emission tomography (PET), which have helped identify the brain regions involved in the conflict resolution and cognitive control required to overcome the Stroop interference.
Central to the neural mechanisms of the Stroop effect is the prefrontal cortex (PFC), particularly the anterior cingulate cortex (ACC) and the dorsolateral prefrontal cortex (DLPFC). The ACC is believed to play a pivotal role in detecting cognitive conflict-such as the mismatch between a word’s color and its meaning-and signaling this information to other brain regions to recruit additional cognitive control[6]. This process helps prioritize the task of naming the ink color over the automatic process of reading the word.
The DLPFC, on the other hand, is associated with the implementation of cognitive control and the management of attentional resources. When faced with a Stroop task, the DLPFC is thought to facilitate the suppression of the automatic reading response, enabling the individual to focus on the color-naming task. This region of the brain is crucial for modulating attention and working memory processes, allowing for the successful resolution of the interference caused by the conflicting stimuli.
Moreover, other brain areas are also implicated in the Stroop effect. The parietal cortex, for instance, is involved in processing visual attention and may contribute to the selection of relevant sensory information (i.e., the color of the ink) over irrelevant information (i.e., the word itself)[7]. Additionally, subcortical structures like the basal ganglia may play a role in the suppression of habitual responses[8], further facilitating the ability to choose the color-naming response over the more automatic word-reading response.
Functional connectivity analyses have also highlighted the importance of the interactions between these regions. The dynamic interplay between the ACC, DLPFC, and other areas reflects the complexity of cognitive control mechanisms engaged to overcome the Stroop interference, demonstrating how the brain coordinates across different regions to manage conflict and prioritize tasks.
In summary, the neural mechanisms underlying the Stroop effect involve a sophisticated network of cortical and subcortical regions that detect conflict, engage cognitive control, and allocate attentional resources. These findings underscore the complexity of human cognition and the sophisticated neurobiological systems that support our ability to navigate competing demands on our attention and behavior.
What can we use it for?
Using this paradigm, we can assess an individual’s cognitive processing speed, their attentional capacity, and their level of cognitive control (otherwise known as their executive function). These skills and facets are implicit in so many ways in which we interact with the world, suggesting that this test reveals a brief – yet incisive – view into human thought and behavior.
The test is also used in a variety of different ways to the original, in an effort to exploit the experimental setup to reveal more about a clinical population, for example. Even neurodevelopmental disorders such as schizophrenia and autism have been examined with the Stroop test.
Furthermore, there are several variations and differing implementations of the test available, allowing different aspects of cognition to be honed in on. One of these variations is the “emotional Stroop test” in which participants complete both the original Stroop, and a version which has both neutral and emotionally charged words. The resulting text features words such as “pain” or “joy” amongst everyday words. Research has shown that anxious people were likely to experience more interference (i.e. more time spent declaring word color) with emotionally charged words, suggesting a preponderance of the emotional word content.
Experimental designs like this allow researchers to target and observe cognitive processes that underlie explicit thought. The test reveals the working of non-conscious brain function and reduces some of the biases that can otherwise emerge in testing.
Other experimental setups utilize the lessons of the Stroop Effect – that incongruent information will require more mental resources to resolve correctly – with numbers, rather than words. Termed the “Numerical Stroop Effect”, this experiment has shown that presenting numbers of incongruent sizes next to each other will slow down reading and comprehension. For an example, see the image below:
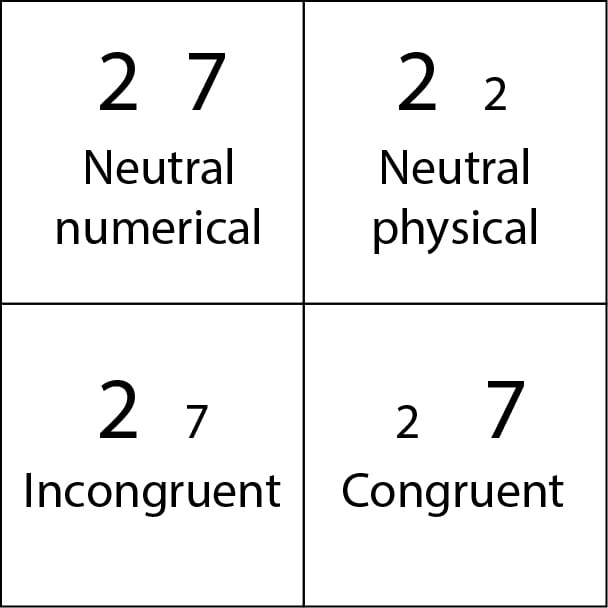
This experiment shows that, with all else being controlled for, incongruence in numerical size will cause the greatest interference, increasing the delay in comprehension. An interesting feature with the Numerical Stroop is that the interference is found for both types of incongruence – when the numbers are incongruent with size, then a delay is shown for reporting the size, as well as for reporting the numbers. This effect reveals that the automatic processing is not just limited to words, suggesting that the brain looks for normal patterns in a variety of presented stimuli, as it appears to struggle when this doesn’t occur.
Get a Demo
We’d love to learn more about you! Talk to a specialist about your research and business needs and get a live demo of the capabilities of the iMotions Research Platform.
The Applications and Implications of the Stroop Effect
The Stroop effect has far-reaching applications and implications across various fields, from cognitive psychology and neuroscience to clinical psychology and beyond. Its ability to elucidate the mechanisms of attention, cognitive control, and the processing speed of conflicting information has made it a valuable tool in both research and practical settings.
In Cognitive Psychology and Neuroscience: The Stroop task is widely used as a research tool to investigate the principles of cognitive control, attention, and information processing. It helps in understanding how the brain manages conflicting information and the efficiency of cognitive control mechanisms across different age groups and cognitive states. This has implications for understanding the development of cognitive control abilities in children, the impact of aging, and the neurodegenerative changes associated with cognitive decline in older adults.
Clinical Applications: The Stroop effect has been applied in the clinical domain to assess and understand various psychiatric and neurological conditions. For instance, individuals with attention deficit hyperactivity disorder (ADHD) or schizophrenia may exhibit increased Stroop interference, indicating difficulties with cognitive control and selective attention. Similarly, the Stroop task can be used to assess executive function in conditions like Alzheimer’s disease and other forms of dementia, providing valuable insights into the cognitive impairments associated with these disorders.
Educational Implications: Understanding the Stroop effect can also have implications for educational strategies, particularly in developing interventions to improve reading skills and attention in children. By understanding the mechanisms of interference and cognitive control, educators can devise methods to enhance cognitive flexibility and attention management in students, potentially improving learning outcomes and academic performance.
Neurorehabilitation: In the field of neurorehabilitation, the Stroop effect is used as a therapeutic tool to help individuals recover from brain injuries or strokes. Cognitive training programs that include tasks similar to the Stroop task can aid in improving cognitive control, attentional capacities, and executive functioning in affected individuals, facilitating their rehabilitation process.
Decision Making and Behavioral Economics: The Stroop effect also has implications for understanding decision-making processes and the influence of cognitive biases. It highlights how conflicting information can impact our ability to make decisions under pressure or when faced with complex information, relevant for fields like behavioral economics and consumer psychology.
Mindfulness and Stress Management: Recent research has explored the use of the Stroop effect in evaluating the impact of mindfulness and stress on cognitive functioning. The performance on Stroop tasks can reflect an individual’s ability to maintain cognitive control under stress, providing insights into stress management techniques and the benefits of mindfulness practices on cognitive health.
In summary, the applications and implications of the Stroop effect are diverse, touching upon various aspects of human cognition and behavior. By providing a window into the intricate workings of the human mind, the Stroop effect continues to inform and inspire research and practice across disciplines, contributing to our understanding of cognitive processes and their impact on our daily lives and wellbeing.
How can the Stroop test be used in biometric research?
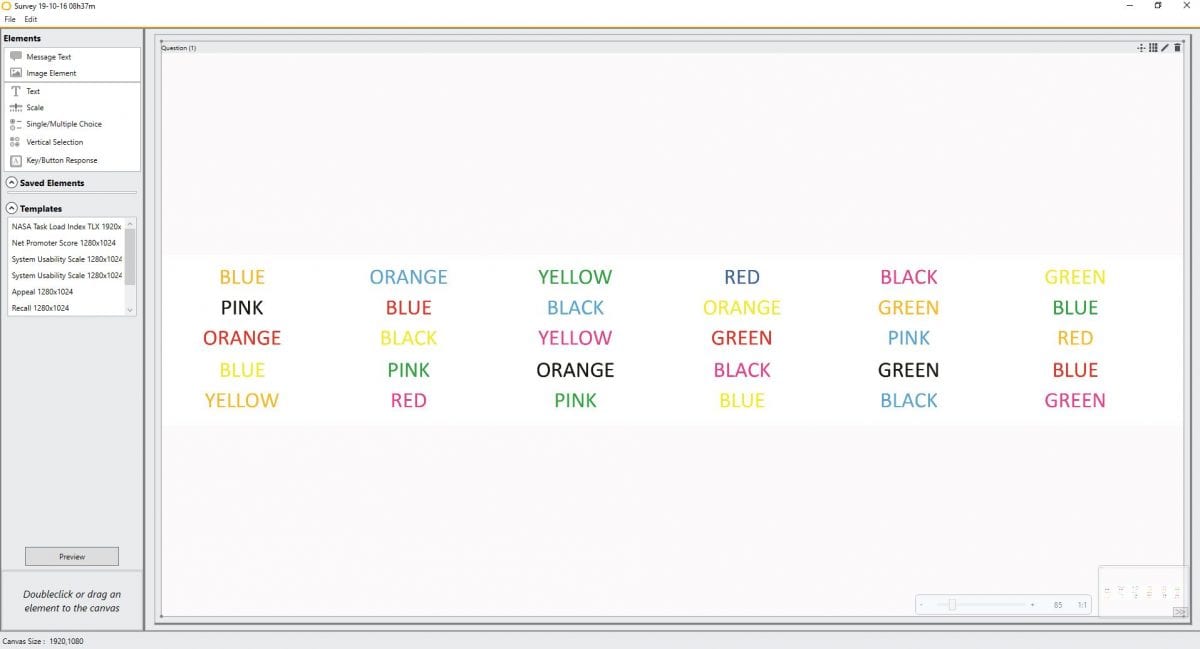
The Stroop test can be simply administered with a basic experimental setup. At its most fundamental, all you need is an image of the Stroop test words, a stopwatch, and someone to record the time and answers (and a willing participant!). However, if you want to gain more insights from the data, there are plenty of ways to take the test further. With iMotions you can simply set up and present the Stroop test, while also expanding the data collection possibilities. Using the survey function, the test can be quickly and simply added. This can be done with either the built-in iMotions survey tool, or with the Qualtrics survey tool, which allows even more metrics to be taken into account.
The ability to record from various synchronized biosensors opens up new avenues for research. For example, with an eye-tracking tool, you can examine exactly how long each participant looks at each word, and their precise speed of comprehension. Using areas of interest (AOIs) can be of particular use as this allows you to analyze specific parts of the scene in isolation, or compared to the data for the scene as a whole, or even with other AOIs. It’s then possible to determine which words demanded the most visual attention, allowing you to accurately dissect the data in fine detail.
Below are a few examples of that idea in practice, each of which took only minutes to set up and start.
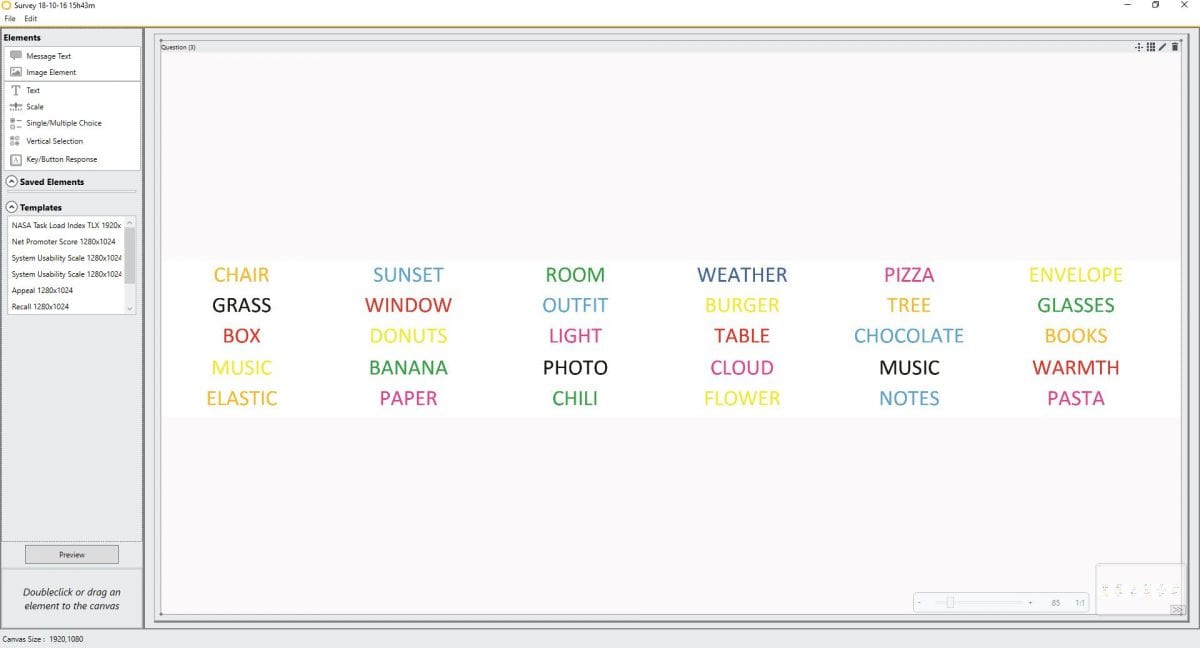
First, we’ve added an image of a Stroop test to the survey function – one version is essentially the same as the original, while another has neutral words mixed with food related words. This version of the Stroop test would require that the participant verbally declare the color of each word – audio recording could help in accurately measuring participant responses. We have also included an example using a multiple choice paradigm that is detailed below, and using the Qualtrics survey function below that.
After we’ve set up eye-tracking and added a participant list, we can add AOIs to the words, so that we can view and analyze data for each. Below is an image of how this looks:
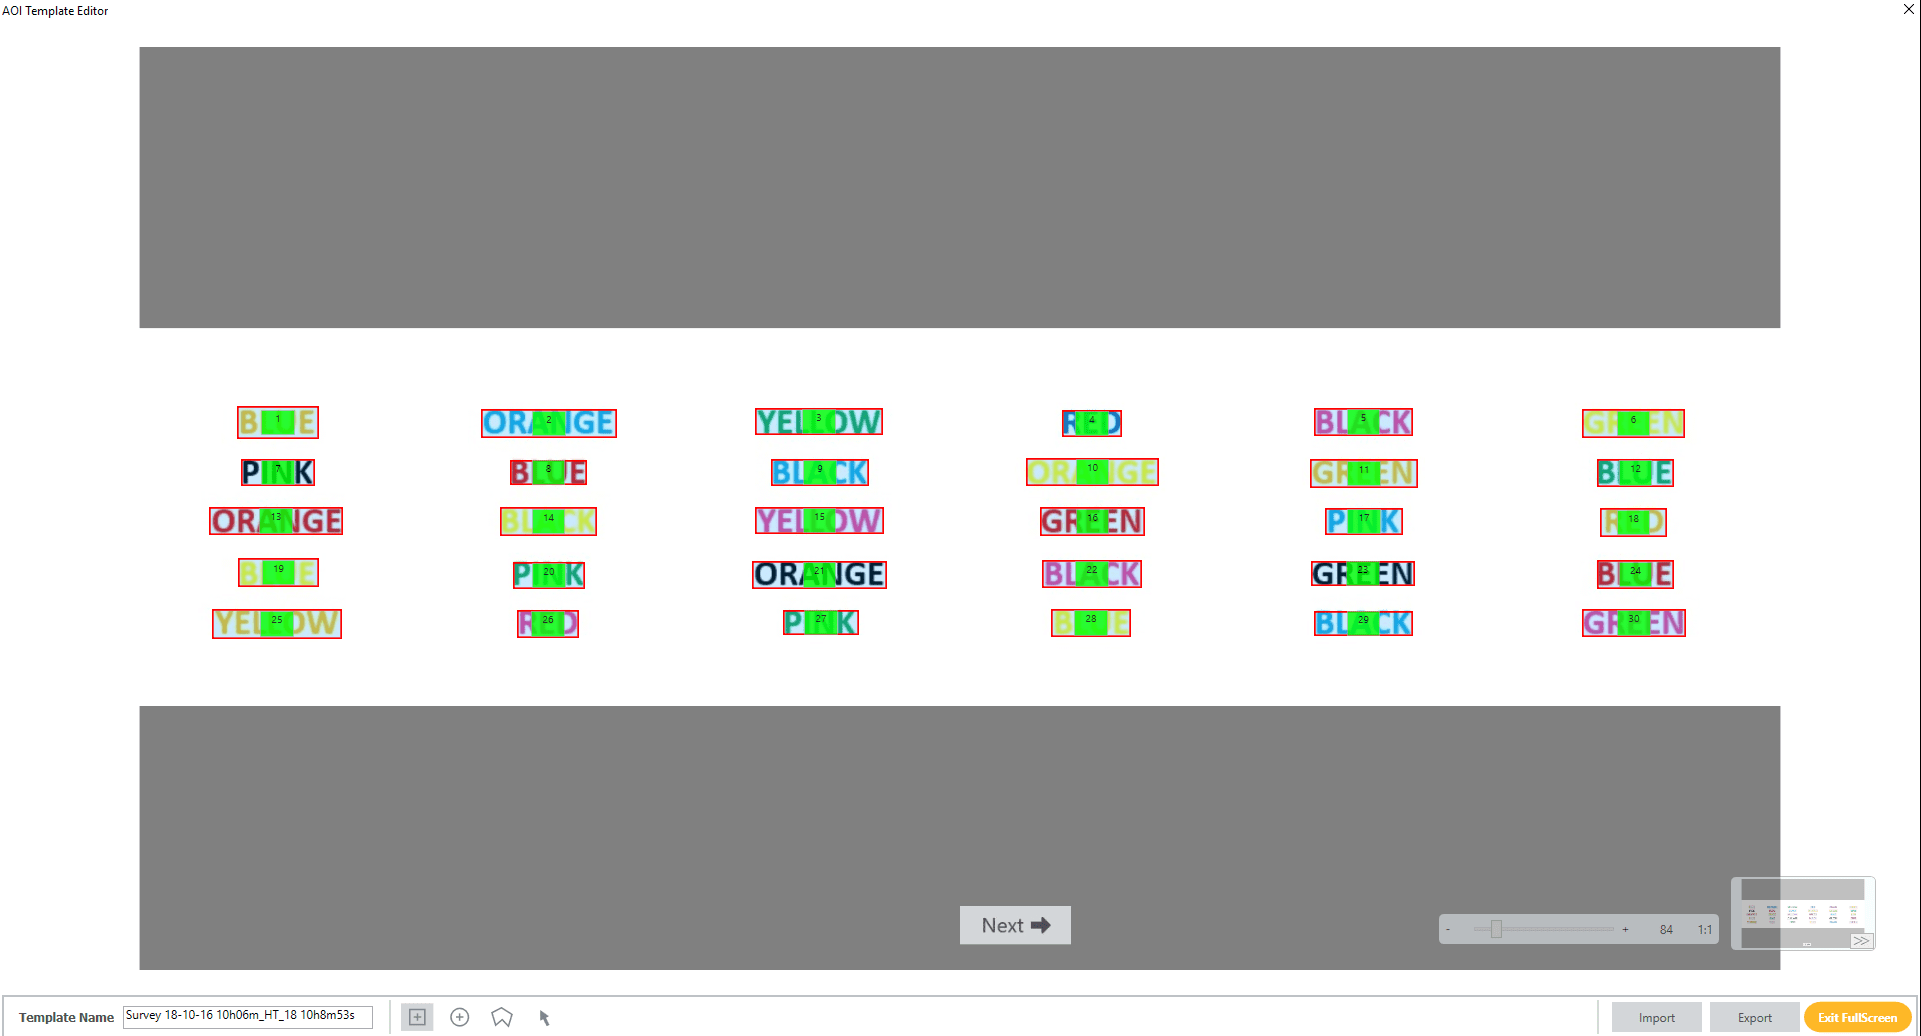
*Note: This is an older version of iMotions AOI- Check out our newest AOI editor
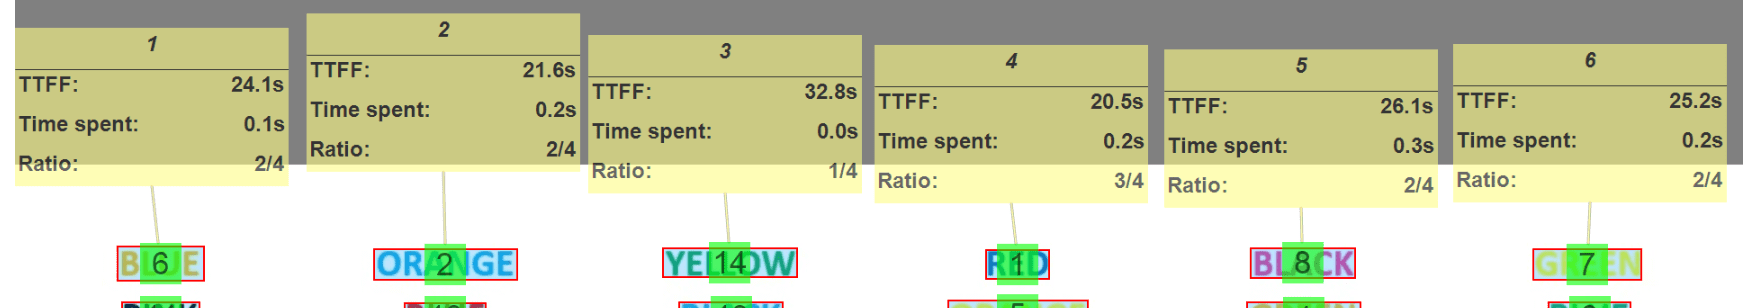
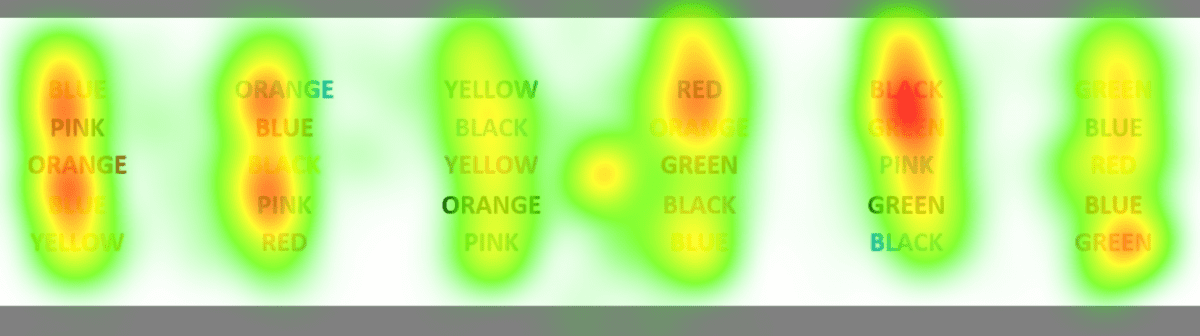
After running through a few participants, we can start to visualize and analyze their data, producing both detailed AOI data, and heatmaps showing overview data. Below are examples of what this data could look like. Of course, more detailed data is available to export and analyze, if desired.
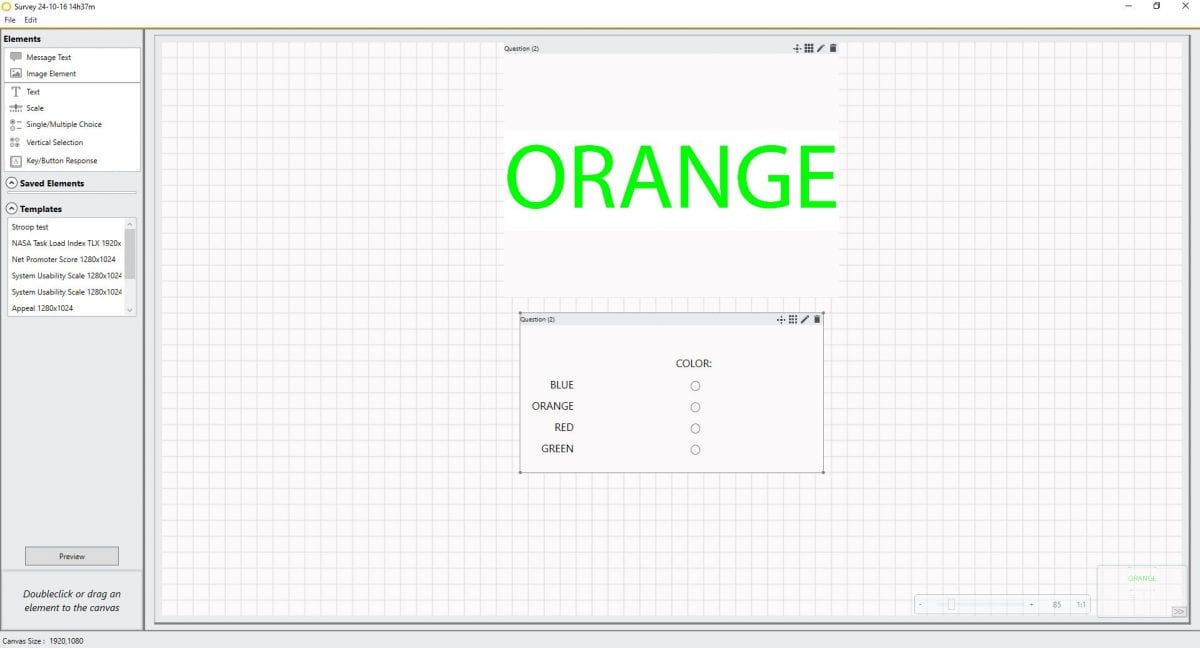
Alternatively, we can insert each word of the Stroop test within the survey setup, and use the keyboard input function for the participant to answer each word color. This would also allow us to investigate the error rate in a more systematic manner. This is shown across the two images below.
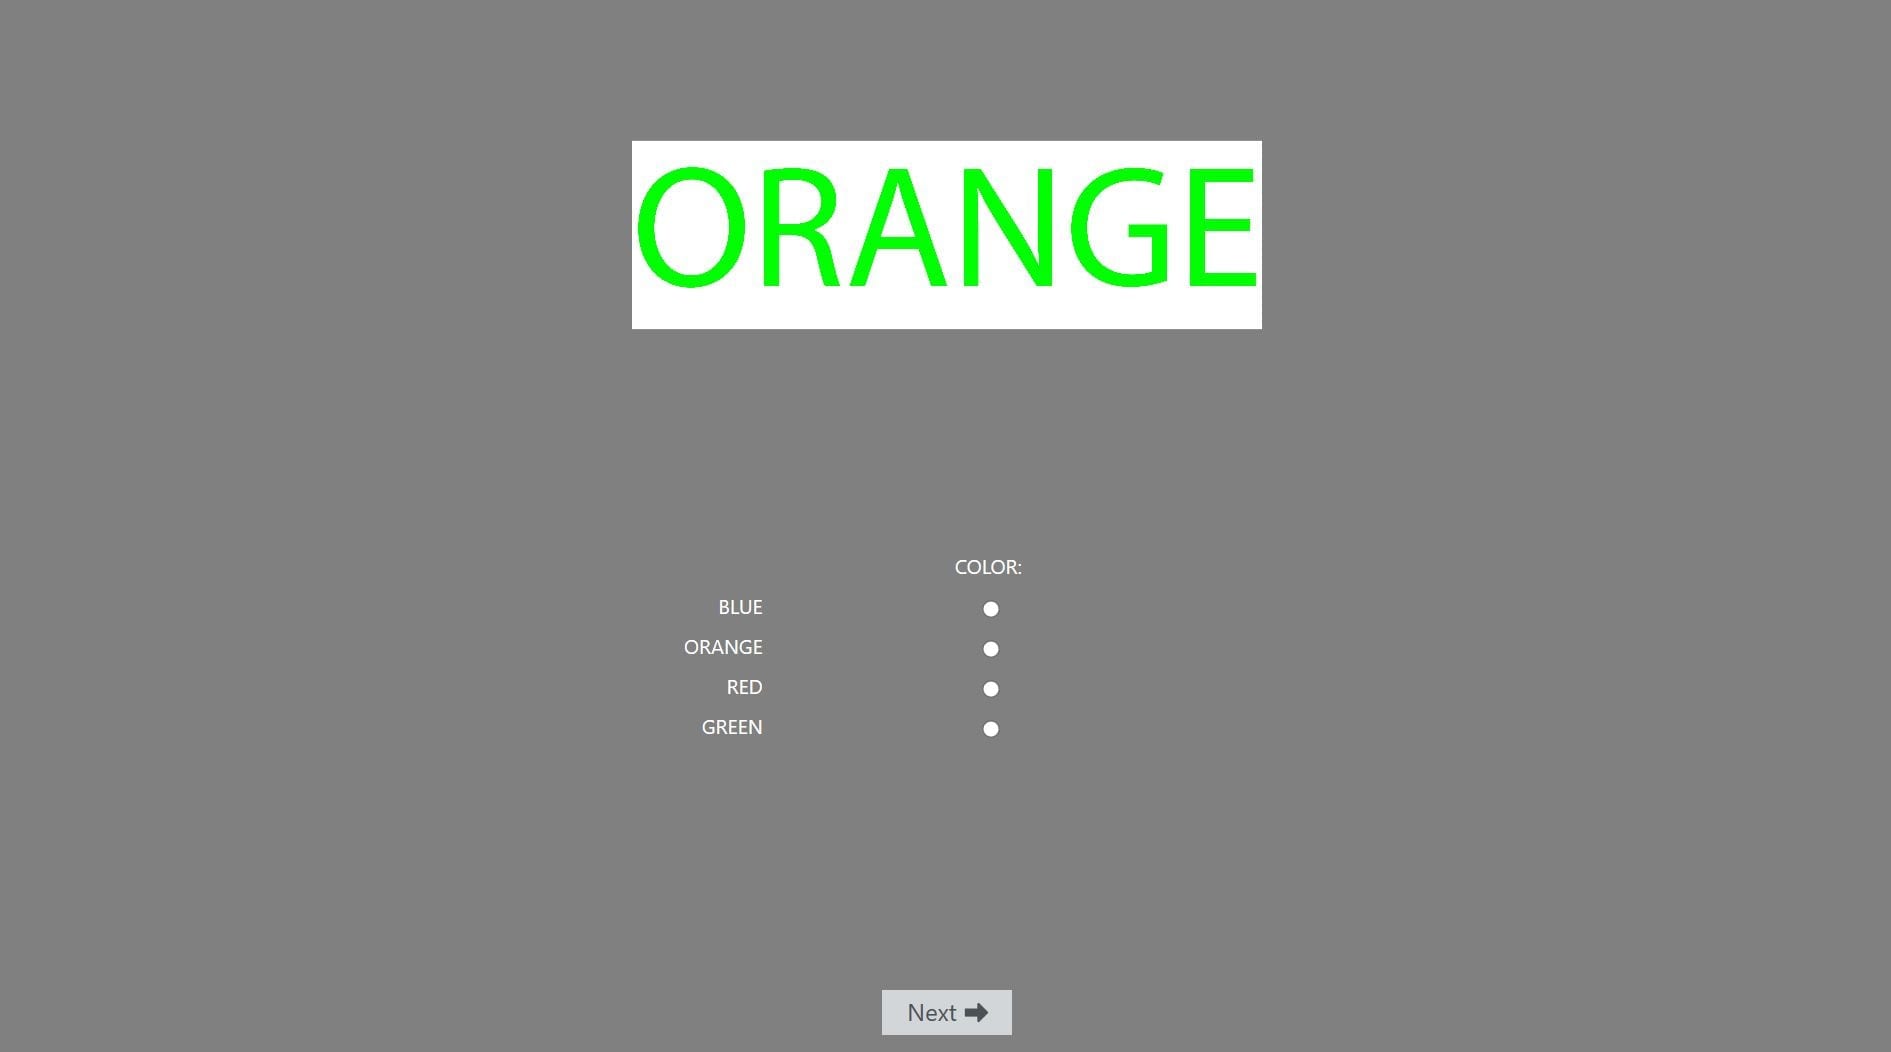
Within this paradigm, eye movements can also be measured, providing information about the amount of time taken to process the information. The approach may take longer for each participant, and remembering the keyboard-color combinations may encumber their cognitive processing (although this shouldn’t present a problem if this approach is used with the correct controls), however it does allow a finer dissection of eye movement for each word, and also informs us about the error rate from incorrect answers.
Using Qualtrics
Finally, we can see how this test is implemented in iMotions using the Qualtrics survey function. This is easily implemented, and appears in a similar way to the above surveys that are built by iMotions. One of the advantages of using Qualtrics is that feedback to participant answers can be immediately provided, should this be desired. The following image shows how the stimulus presentation appears on screen.
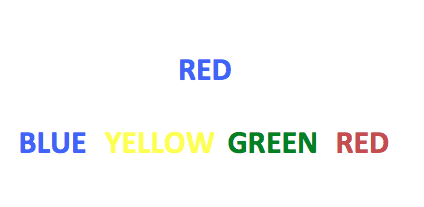
The participant can then click on the corresponding color to answer the question. If an incorrect answer is chosen, the response would be shown as below.
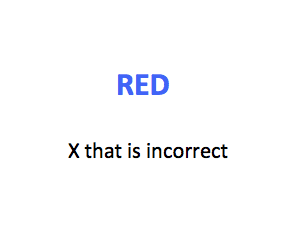
The participant can then proceed to complete other questions, and their answers will be recorded, allowing later analysis and visualization of the results.
With all of the information completed and data analyzed, we can now start to discern which words showed the greatest amount of Stroop interference (the latency produced when naming the color that the word is printed in). Having several paradigms with different colors, words, and with only blocks of colors will provide more baseline information and control for experimental error. Ultimately this gives a good basis for the participant data to be normalized, and compared with more validity.
We can now test if there is any difference with the words of interest and potentially start to draw conclusions about the implicit thoughts of participants (with the example above, it could be that participants who are hungrier would spend a longer duration in naming the colors of the words, suggesting those words are more salient to them).
Frequently Asked Question
The Basic Stroop Task
The basic Stroop task is a psychological test that illustrates the interference in reaction times between conflicting information. Participants are presented with color names printed in incongruent ink colors. For example, the word “red” might be printed in blue ink. The task requires individuals to name the ink color while ignoring the word itself. This creates a cognitive conflict, as the brain’s automatic tendency to read the word interferes with the task of naming the ink color.
Time Limit for Stroop Task
Traditionally, the Stroop task does not have a fixed time limit for responses. The emphasis is rather on accuracy and reaction time. Participants are typically instructed to respond as quickly and accurately as possible. The reaction time – the duration between stimulus presentation and the participant’s response – is the critical measurement. This time is recorded to evaluate the cognitive processing speed and the degree of interference experienced by the individual.
Who is Most Affected by the Stroop Test
The Stroop effect, generally, tends to be universal, but its intensity can vary among individuals. It is most pronounced in people with higher cognitive control and stronger automatic reading abilities. Children, older adults, and individuals with certain neurological or psychiatric conditions (like ADHD or schizophrenia) may exhibit greater Stroop interference. Variations in performance can also be influenced by factors such as language proficiency, fatigue, and attentional capacity.
The Limitations and Challenges of the Stroop Effect
While the Stroop effect is a powerful tool for understanding cognitive processing and control, it is not without its limitations and challenges. These limitations pertain to the interpretation of Stroop data, the generalizability of findings, and the complexity of isolating cognitive processes.
Interpretation of Results: One of the primary challenges associated with the Stroop effect is the complexity involved in interpreting the results. The Stroop task measures several cognitive processes simultaneously, including attention, perception, and response selection. Disentangling these processes to isolate the source of Stroop interference can be challenging, making it difficult to attribute performance changes to specific cognitive mechanisms.
Generalizability: The extent to which Stroop effect findings can be generalized across different populations and settings is another concern. Most Stroop research has been conducted in laboratory environments with controlled conditions, which may not accurately reflect real-world scenarios. Additionally, cultural differences in language processing and color perception can affect Stroop task performance, raising questions about the universality of the effect.
Variability in Task Design: There is considerable variability in how Stroop tasks are designed and administered, including differences in the words used, the colors chosen, and the method of response (verbal vs. manual). This variability can lead to inconsistencies in findings across studies and complicate comparisons between different research projects. Standardization of the task could help mitigate these issues but might also limit the flexibility needed to explore specific research questions.
Individual Differences: Individual differences in cognitive abilities, personality traits, and neurological organization can significantly affect performance on the Stroop task. For example, individuals with high cognitive control or working memory capacity may show less Stroop interference. These differences highlight the challenge of using the Stroop effect as a one-size-fits-all measure and underscore the importance of considering individual variability in cognitive research.
Use in Clinical Populations: While the Stroop task has been applied in clinical settings to assess cognitive impairments, its sensitivity and specificity are not always sufficient for diagnostic purposes. The Stroop effect can indicate general issues with executive function, but it does not pinpoint specific neurological or psychiatric conditions. Therefore, it should be used as part of a broader battery of tests rather than a standalone diagnostic tool.
Neuroimaging Limitations: Although neuroimaging studies have shed light on the neural mechanisms underlying the Stroop effect, interpreting these findings can be complex. The brain areas involved in the Stroop task are also implicated in a wide range of other cognitive processes. Thus, attributing activation patterns solely to the Stroop effect without considering the broader cognitive context can be misleading.
In summary, while the Stroop effect remains a valuable tool in cognitive psychology and neuroscience, it is essential to acknowledge its limitations and challenges. Researchers must carefully design studies, interpret findings within the appropriate context, and consider individual and cultural differences when applying the Stroop task. By addressing these challenges, the Stroop effect can continue to provide valuable insights into the complexities of human cognition.
Conclusion
The Stroop test is a widely-used, well established methodology that reveals various brain functions, and implicit cognitive workings. The original article has now been cited over 13,000 times and that number will surely continue to rise well into the future. With iMotions, it’s easy to start asking questions with the Stroop Task and to get to the answers quickly. To see how the Stroop effect can be set up and used with iMotions, explore the recent article from researchers at Wrocław University.
If this article has piqued your interest, contact us and hear how we can help with your research needs and questions.
References
[1] https://en.wikipedia.org/wiki/Stroop_effect
[2] https://psycnet.apa.org/doiLanding?doi=10.1037%2Fh0054651
[3] https://link.springer.com/referenceworkentry/10.1007/978-3-319-56782-2_1910-2
[4] https://link.springer.com/article/10.1007/s00426-021-01554-x
[5] https://www.simplypsychology.org/stroop-effect.html
[6] https://link.springer.com/article/10.1007/s10548-014-0367-5
[7] https://journals.plos.org/plosone/article?id=10.1371/journal.pone.0256003
[8] https://link.springer.com/article/10.1007/s00426-021-01554-x