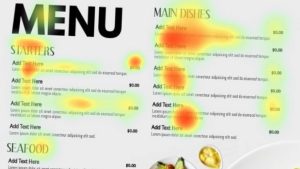
A central feature of iMotions software is its ability to visualize and analyze data coming from the broad range of biosensor hardware. Without the help of iMotions R Notebooks, the signal coming from the hardware would be very difficult and time consuming to decipher and analyze. But what actually are “R Notebooks” and how do they help you make sense of your sensor data?
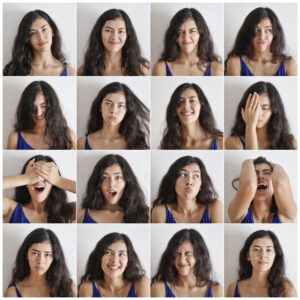
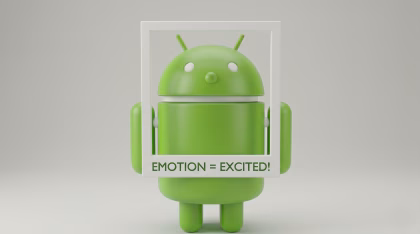
Join Product Specialists Jessica Wilson, PhD and Ranli Wang for an in-depth tour of the analysis capabilities using iMotions R Notebooks. We walk you through how the transparent, flexible R-based notebooks can be applied to concrete research use cases, and we’ll give a live demo of the Notebooks for use with Facial Expression Analysis, eye tracking, electrodermal activity, heart rate, and EEG.
Whether you’re a newcomer to behavioral research or a seasoned iMotions user who is new to R Notebooks, this webinar is your first step to analyzing and presenting findings from sensor data using accurate visual representations and easy-to-understand metrics.