Executive Summary
Understanding emotions requires more than observation, it depends on accurately measuring physiological signals generated by the body. One of the most reliable methods is electrodermal activity (EDA), also known as galvanic skin response (GSR).
EDA is defined as the measurement of skin conductance changes driven by the sympathetic nervous system, and it is widely used to assess emotional arousal in research and applied settings.
Within EDA, two key components are analyzed:
- Skin Conductance Responses (SCRs): rapid, stimulus-driven increases in arousal
- Skin Conductance Level (SCL): slower, baseline changes over time
SCRs can also be categorized into:
- Event-Related SCRs (ER-SCRs) – triggered by specific stimuli
- Non-Specific SCRs (NS-SCRs) – occurring without a clear external trigger
A core method in EDA analysis is EDA peak detection (also known as GSR peak analysis), which identifies meaningful fluctuations in the signal to quantify emotional intensity. This involves techniques such as signal filtering, threshold setting, and peak detection algorithms.
Importantly, EDA measures the intensity of an emotional response, not its valence, meaning it cannot determine whether an emotion is positive or negative. To fully understand emotional states, EDA is often combined with self-report data or facial expression analysis.
Table of Contents
Science requires measurements, but it also of course requires an understanding of what we are measuring. Measurement alone doesn’t get us very far.
The science of emotions is a process that requires measuring the signals generated by our bodies. As emotions are generated in our bodies, so it follows that the data is there too. The body gives off many signals, and these are rarely merely random processes – instead they reflect something about our physiological or psychological state.
Discerning which signals to follow is then a new challenge. Luckily, a great deal of work has already been done in this area, – one of the principal ways in which emotional arousal is measured is through detection of the galvanic skin response (GSR, otherwise more commonly known as electrodermal activity or EDA).
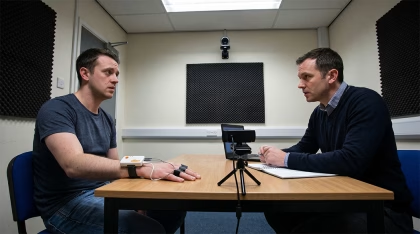
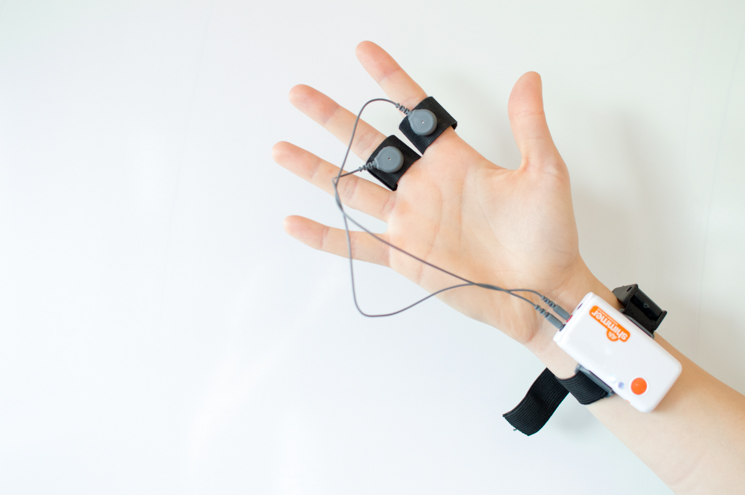
GSR refers to the variation of the electrical conductance of the skin in response to skin secretion (often in minute amounts). This data is collected by applying a low, undetectable, and constant voltage to the skin and then measuring how the skin conductance varies [1, 2]. This can be done through the application of electrodes to the skin (and of course a device that measures this activity).
While GSR activity is also linked to the regulation of our internal temperatures [1, 3], research has also repeatedly shown the strong association this signal has with emotional arousal [4, 5, 6]. The signals that are produced by the sympathetic nervous system lead to a change in the Skin Conductance Response (SCR), which is what is typically looked at by researchers.
Understanding the nuances of these physiological signals is crucial for accurate research and application. For a thorough exploration of all aspects of this powerful biometric, we invite you to consult our comprehensive Galvanic Skin Response guide.
Beyond theoretical understanding, achieving truly accurate research and application depends heavily on your experimental setup. Ensure your studies yield reliable data by exploring the 5 essentials for an optimal GSR research setup.
What is SCR / SCL?
The SCR is proportionally related to the number of sweat glands that are activated, meaning in essence that the more emotionally aroused an individual is, the more the SCR amount is increased. It can also be inferred that the SCR amplitude is a suitable proxy of sympathetic nervous system activity [1].
The SCR is often referred to as a “peak” of activity (and thus, a “GSR peak”) as it appears as a rapid increase in the signal value. If the SCR appears in response to a stimulus (typically within 1-5 seconds [7]), then it is referred to as an Event-Related SCR (ER-SCR), while if it appears without any discernible cause, it’s referred to as a Non-Specific SCR (NS-SCR).
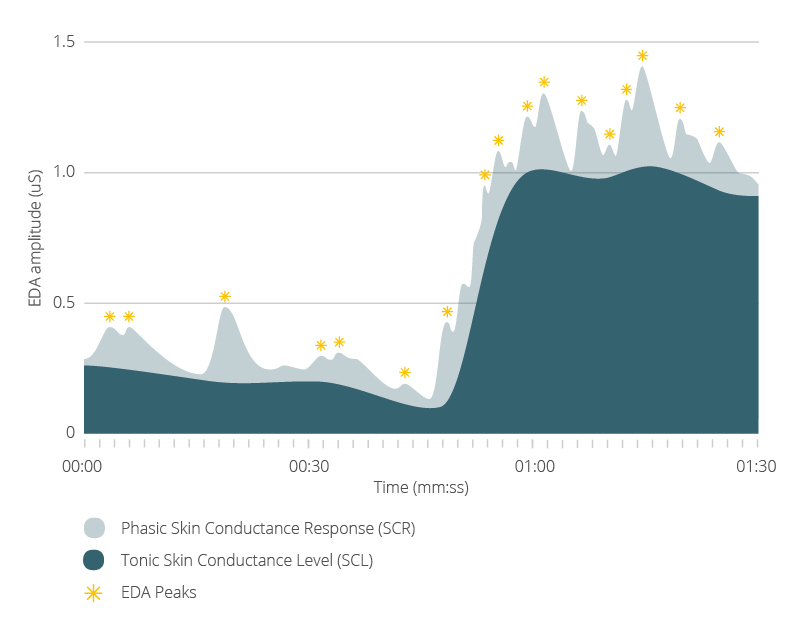
While the SCR is one component of the GSR activity, this only represents the fast-changing signal in response to a stimulus. The other component is the tonic, continuous, slowly-changing Skin Conductance Level (SCL).
A central problem of analyzing the GSR data is how to separate these two signals. When we look at the data, there is no clear line that demarcates which is which; we need to perform this calculation ourselves. Below, we will give you a walkthrough of one of the most common ways in which this is done, to give you a better understanding of what goes on behind the scenes of GSR data analysis, and to give you a clearer path to carry this out yourself.
GSR Peaks
While SCRs are fast in their appearance, the signal they produce takes longer to decline to baseline. This ultimately means that if another SCR occurs shortly after another, then the overall GSR activity levels will increase even more. This cumulative effect can lead to an underestimation of the SCR amplitude, as the true “trough” (the beginning of the increase in activity related to the SCR) is hidden within the slow decline of the previous peak of activity.
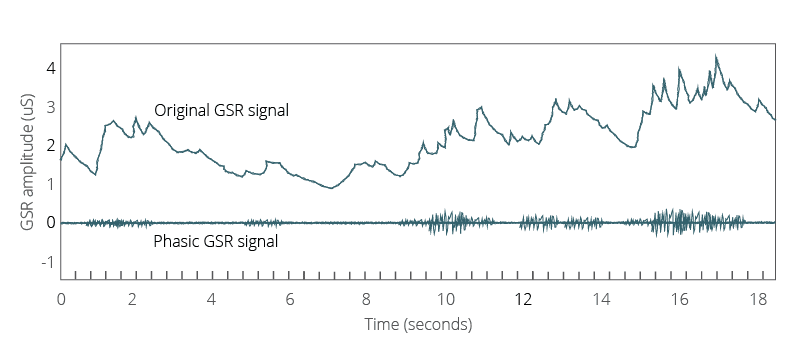
To get around some of the impacts of this effect, the data can be filtered in order to provide a clearer view of the processes. The first step is to average the data. This can be done by splitting the data into discrete windows (e.g. +/- 4 seconds), and then averaging the values that are present within that timeframe. This average can then be extracted from the values, to give a normalized view of the data (in theory, with the tonic data signal largely removed).
Once this is complete, it’s possible to remove some of the background noise from the signal. This may occur due to the GSR device being too close to a computer and inadvertently picking up electrical signals, for example. By applying a low-pass filter, in which the values must pass above a certain threshold, the lower range values of the signal are removed.
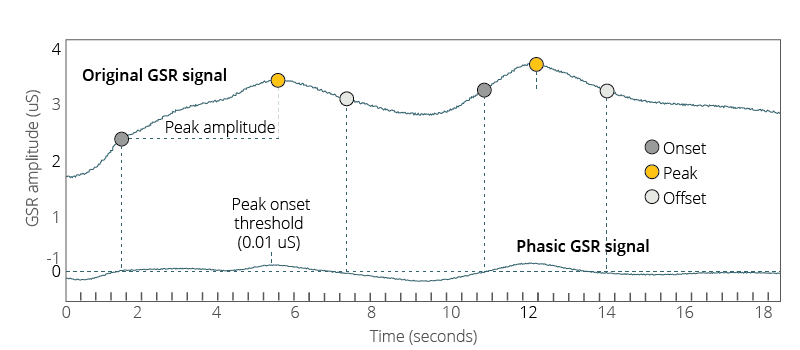
Following this, several parameters can be set in order to accurately detect the existence of a GSR peak. These include the onset and offset, the threshold of the peak amplification, and the signal jump threshold.
The values for the onset and the offset of any peaks need to be set in order to determine the rise and fall of the signal. The occurrence of the onset and offset (in micro Siemens, µS) can be created in order to filter the direction of the signal.
This is typically done as setting the onset to be >0.1 µS (so that only signals that move above this value are considered a potential peak), while the offset is typically set as <0.0 µS (so that the signal value must decrease, allowing the detection of a peak, otherwise a continuous increase would meet the criteria thus far).
The peak amplification threshold is set to determine which value (typically set to 0.05 µS) the peak must pass above following the onset in order to be tracked as a peak (and not just a gradual increase of the data).
The signal jump threshold works as a limit to the peak amplification amount – any value that passes above this threshold (e.g. 0.1 µS) within one sample to the next is considered to be too rapidly rising to reflect a true physiological process, and is therefore discarded.
With these limits set, a counting of the data points should reflect the number of GSR peaks that exist within the data.
The data can also be aggregated across participants in order to give a clearer view of potential group effects. Comparing the number of GSR peaks could, for example, tell you which group overall showed an increase of decrease of emotional arousal in response to a stimulus.
The above process is carried out essentially automatically in iMotions (you just need to click through the analysis, and change the default values if needed), which reduces the burden of calculating this analysis yourself. This is also easily implemented on a group level, giving you a clear path to understanding how emotional arousal levels can differ across groups.
While iMotions simplifies the analytical phase, the accuracy of your insights fundamentally depends on the quality of your initial data capture. To ensure your data foundation is solid, explore the optimal GSR research setup detailed in our guide.
What can this data tell you?
The GSR data can provide a measurement of how strongly an emotion was experienced, although not the direction of the emotion. Increases in GSR activity have been directly related to a variety of emotional states, showing the importance of this physiological response in the experience of emotions [8].
Determining the amount of SCR occurrences provides a way to quantify the differences between individuals or groups, giving insight into how reactions to different stimuli might occur, or if variations exist among populations in response to the same stimulus. With all of this in mind, we can begin to really understand what we’re measuring when it comes to emotions.
I hope this post has provided you with new knowledge surrounding SCRs, as well as GSR in general. To get a more complete and thorough understanding, download our free guide below.
Free 36-page EDA/GSR Guide
For Beginners and Intermediates
- Get a thorough understanding of all aspects
- Valuable GSR research insights
- Learn how to take your research to the next level

References
[1] Benedek, M., & Kaernbach, C. (2010). A continuous measure of phasic electrodermal activity. Journal of Neuroscience Methods, 190(1), 80-91. doi:10.1016/j.jneumeth.2010.04.028
[2] Fowles DC, Christie MJ, Edelberg R, Grings WW, Lykken DT, Venables PH. Publication recommendations for electrodermal measurements. Psychophysiology, 1981;18(3):232–9.
[3] Wenger CB. Thermoregulation. In: Freedberg IM, Eisen AZ, Wolff K, Austen KF, Goldsmith LA, Katz SI, editors. Dermatology in general medicine, 1. New York: McGraw-Hill; 2003. p. 119–27.
[4] Boucsein W. Electrodermal activity. New York: Plenum University Press; 1992.
[5] Critchley, H. (2002). Review: Electrodermal Responses: What Happens in the Brain. The Neuroscientist, 8(2), pp.132-142.
[6] Anders, S., Lotze, M., Erb, M., Grodd, W. and Birbaumer, N. (2004). Brain activity underlying emotional valence and arousal: A response-related fMRI study. Human Brain Mapping, 23(4), pp.200-209.
[7] Dawson ME, Schell AM, Filion DL. The electrodermal system. In: Cacioppo JT, Tassinary LG, Berntson GG, editors. Handbook of psychophysiology. Cambridge: University Press; 2007. p. 159–81.
[8] Kreibig, S. D. (2010). Autonomic nervous system activity in emotion: A review. Biological Psychology, vol. 84, no. 3, pp. 394–421.


![Featured image for How to Set Up a Cutting-Edge Research Lab [Steps and Examples]](https://imotions.com/wp-content/uploads/2023/01/playing-chess-against-robot-300x168.webp)