
Discover how you can uncover unfiltered insights into consumer motivation with EEG and frontal asymmetry. By measuring differences in left- and right-frontal brain activity, you can see whether people are drawn toward—or away from—your product, ad, or experience. This approach bypasses biases from surveys and focus groups, capturing real-time, objective responses that reflect approach or avoidance tendencies. Whether you’re testing new product concepts, ads, or experiences, frontal asymmetry lets you measure engagement, emotional valence, and motivation with precision—online, in-store, or in the lab.
Table of Contents
Imagine you’re creating a new product or service that you think is fantastic. Maybe you’re just starting the process, or have even already come up with a full marketing plan, and have gotten the word out to people. But will they actually like what your product or service has to offer? Will it catch their sincere interest and curiosity? Will they be willing to spend money on it during the launch?
There’s a way to answer all of these questions, by measuring how the brain fundamentally responds to the new product (or any other stimulus) – this is done by measuring what is called frontal asymmetry.
Consumer insights on motivation – the behavioral way
To begin, you could ask people on the street directly, hand out surveys to dedicated focus groups or observe their behavior in simulations and test environments. However, self-reports might be biased, focus groups might not be representative of your target audience, and behavioral observation by expert coders is costly, time-intensive, and also prone to errors.
Motivation – the neuroscience way
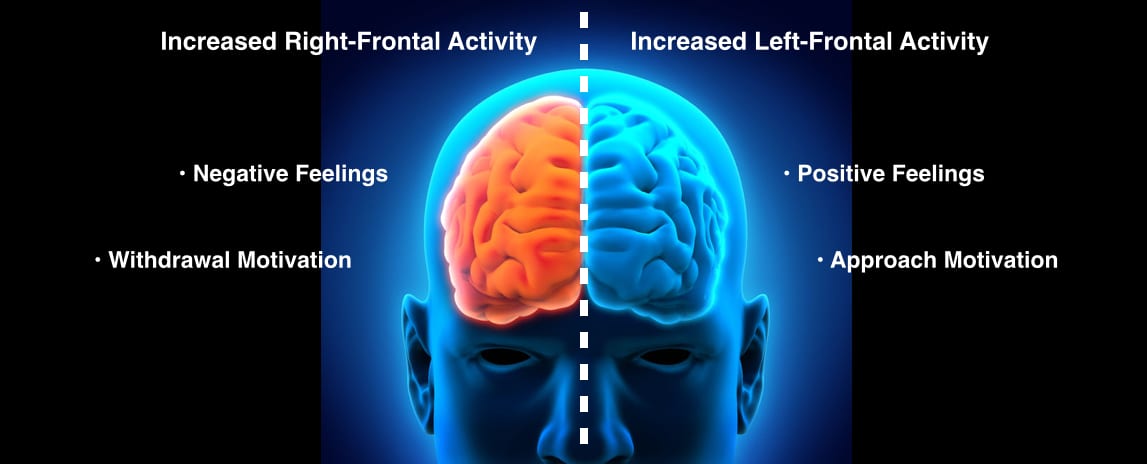
If your goal is to “glimpse into people’s heads” to confirm their attitude towards your product and get a feel for whether or not they would go for it, you might be excited to hear that neuroscience research has identified an unfiltered and unbiased phenomenon associated with emotion and motivation, which is generally referred to as “frontal asymmetry”. Neuropsychologists have consistently found that higher engagement of the left – relative to the right frontal brain – is related to positive feelings and higher engagement (Coan et al., 2003).
Frontal asymmetry index – a marker of approach and avoidance
“Engagement” in this case is expressed as frequency power over left and right frontal regions (in the International 10-20-System, electrodes F3/F4 and F7/F8 are the most sensitive candidates). Many studies use the (13-25 Hz) beta or (> 30 Hz) gamma frequency bands, but there are also studies using the (8-12 Hz) alpha frequency band.
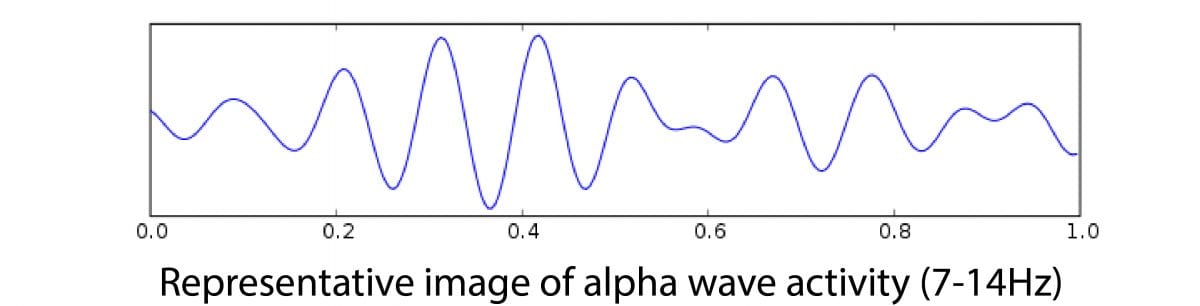
Due to the inverse relationship between (8-12 Hz) alpha power and cortical activity (meaning that the less alpha range activity that there is, the more brain activity there is), decreased alpha power reflects increased engagement. In short: more brain activity means less alpha power, less brain activity means more alpha power.
The special effect of the asymmetry in frontal alpha power was initially detected in studies investigating biomarkers of personality (Hagemann, Naumann, Thayer, & Bartussek, 2002): Here, people with increased left-frontal alpha were found to process information in a rather positive way, whereas right-lateralization indicated a more negative processing mode.
States and Personality Traits
While this “emotional” effect was found to be indicative of a personality trait (supposed to be very stable across the life span), recent evidence suggests that it also varies dependent on emotional stimulation, reflecting whether or not someone is drawn towards or away from something or someone. In short, this “approach-avoidance effect” reflects someone’s motivation (Harmon-Jones et al., 2010).
Relatively increased left-frontal activity may serve as an index of approach motivation or related emotion (e.g., anger and joy). In contrast, relatively increased right-frontal activity may serve as an index of withdrawal motivation or related emotion (e.g., disgust, fear, and sadness).
How to calculate frontal asymmetry
The frontal asymmetry index can be computed in a fairly simple manner from raw frontal EEG data, and is even easier in iMotions. The two electrodes that you need are F3/F4 and F7/F8 (almost all 10-20 headsets comprise these locations – if your EEG system doesn’t have these electrodes F3, you can also use electrodes in the vicinity of the original F3/F4 and F7/F8 locations). To complete the steps in iMotions, there’s a simple route to take – you can specify which frontal electrodes are of interest, and view the aggregate output in graph form, as shown below.
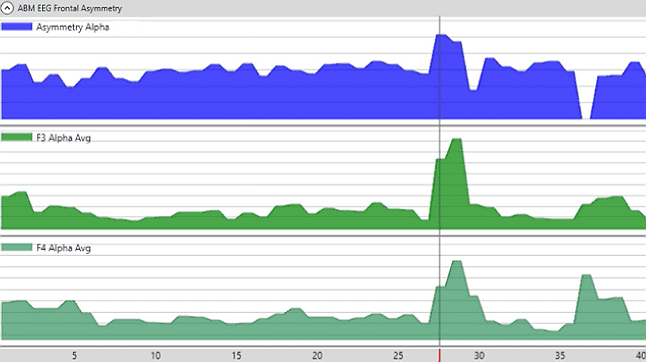
To export this data, iMotions processes the required algorithms for you. This both removes the burden of completing this task manually, and also helps you in understanding the data even quicker. You can even select which participants you would like the data from. Ultimately, you can view the exported data, just as shown below.

That’s all there is to it in iMotions, but if you want to compute the frontal asymmetry index manually, you can follow the steps below:
- Pre-process the data to attenuate artifacts and increase signal-to-noise ratio. Procedures vary from study to study, so general recommendations cannot be made. However, excellent resources exist where data pre-processing and filtering is explained in more detail (link to Steve Luck’s and Mike X. Cohen’s books).
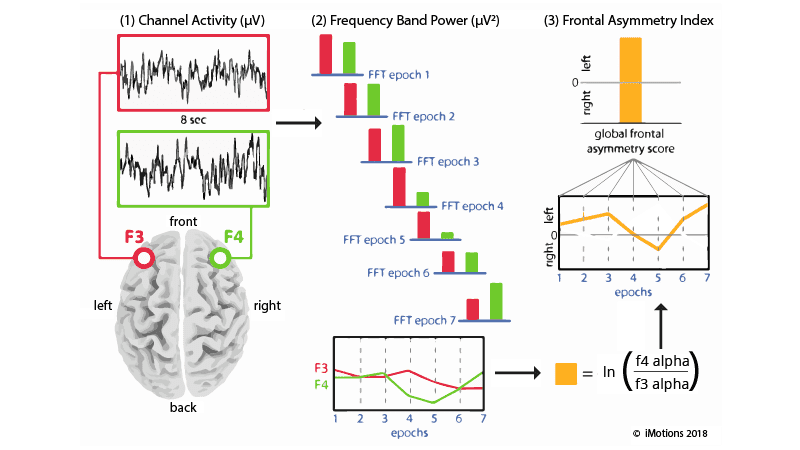
- Epoch the data. In this signal processing step, the continuous data is broken into smaller parts. Scientific studies recommend overlapping epochs with each limited to a duration of 1-2 seconds. For each epoch, compute the Fast Fourier Transformation (FFT). The FFT determines which frequencies underlie the actual data, allowing you to extract the power in a specific frequency band.
- Compute the frontal asymmetry index:
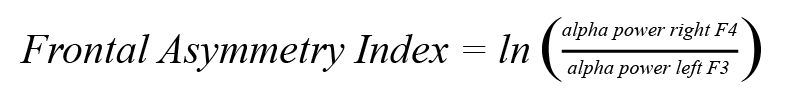
This procedure generates one value per epoch. You can now plot the time course of the values to visualize the change in motivation over the course of the stimulus duration. Additionally, you can average values across all epochs to get a global frontal asymmetry score.
Using the natural log of the scores not only provides the basis for the frontal asymmetry index, but also provides a certain amount of correction for the alpha power, by smoothing the (sometimes quite variable) data.
Summary – the benefits of using EEG
Taken together, frontal asymmetries of alpha, beta, or gamma frequency bands can be interpreted with respect to the amount of motivation towards (approach) or away from (avoidance) something or someone. Frontal asymmetry can be extracted from EEG headsets with electrodes located at frontal scalp regions (ideally, F3 and F4). The excellent time resolution of the EEG allows the analysis of short-term changes in motivation over the course of a stimulus presentation (e.g., picture- or video-based advertisements, trailers, videos, shows), also in mobile applications beyond stationary lab setups (field and in-store studies).
If you would like to learn more about frontal asymmetry, and how to measure motivation and other EEG metrics, download our free EEG guide below.