In 1924 a drop-out astronomer became the first person to record the electrical activity of the human brain. Hans Berger, who was more mystic than scientist (1), attached an electrode to the scalp of a willing participant, saw the electrical activity readout on to paper, and created what we now know as electroencephalography, or EEG.
The field has gone through leaps and bounds in the almost one hundred years since the first recording, but the principle for hardware remains essentially the same – electrodes are attached to the scalp and the brain activity is recorded.

There is one aspect that has changed fundamentally from those first recordings – the paper has been replaced with software. While Berger and other early scientists had to make do with visual inspection of the readout, software has revolutionized how we collect, process, and analyze EEG data.
iMotions is an adaptable software for human behavior research that allows you to collect, process, and carry out various analyses with EEG devices. Below, we will go through some of the features available with our EEG module – if you’d like to learn more, get in touch, and talk with our experts.
How iMotions integrates with EEG hardware
The iMotions EEG module provides integrations with eight different EEG headsets, from four leading hardware providers: Neuroelectrics, Advanced Brain Monitoring (ABM), and Brain Products. This flexibility allows you to choose the hardware according to your needs – from recordings with an 8 channel headband, to more high-resolution recordings with 32 channels, wireless through BlueTooth, WiFi, or wired, stationary setups.
We have a blog post that compares technical specifications from various EEG hardware.
These options provide flexibility not only in terms of hardware capabilities but also for one of the most important factors – the budget. If you’d like to see a breakdown of some of the hardware costs, visit our blog post that covers EEG pricing.
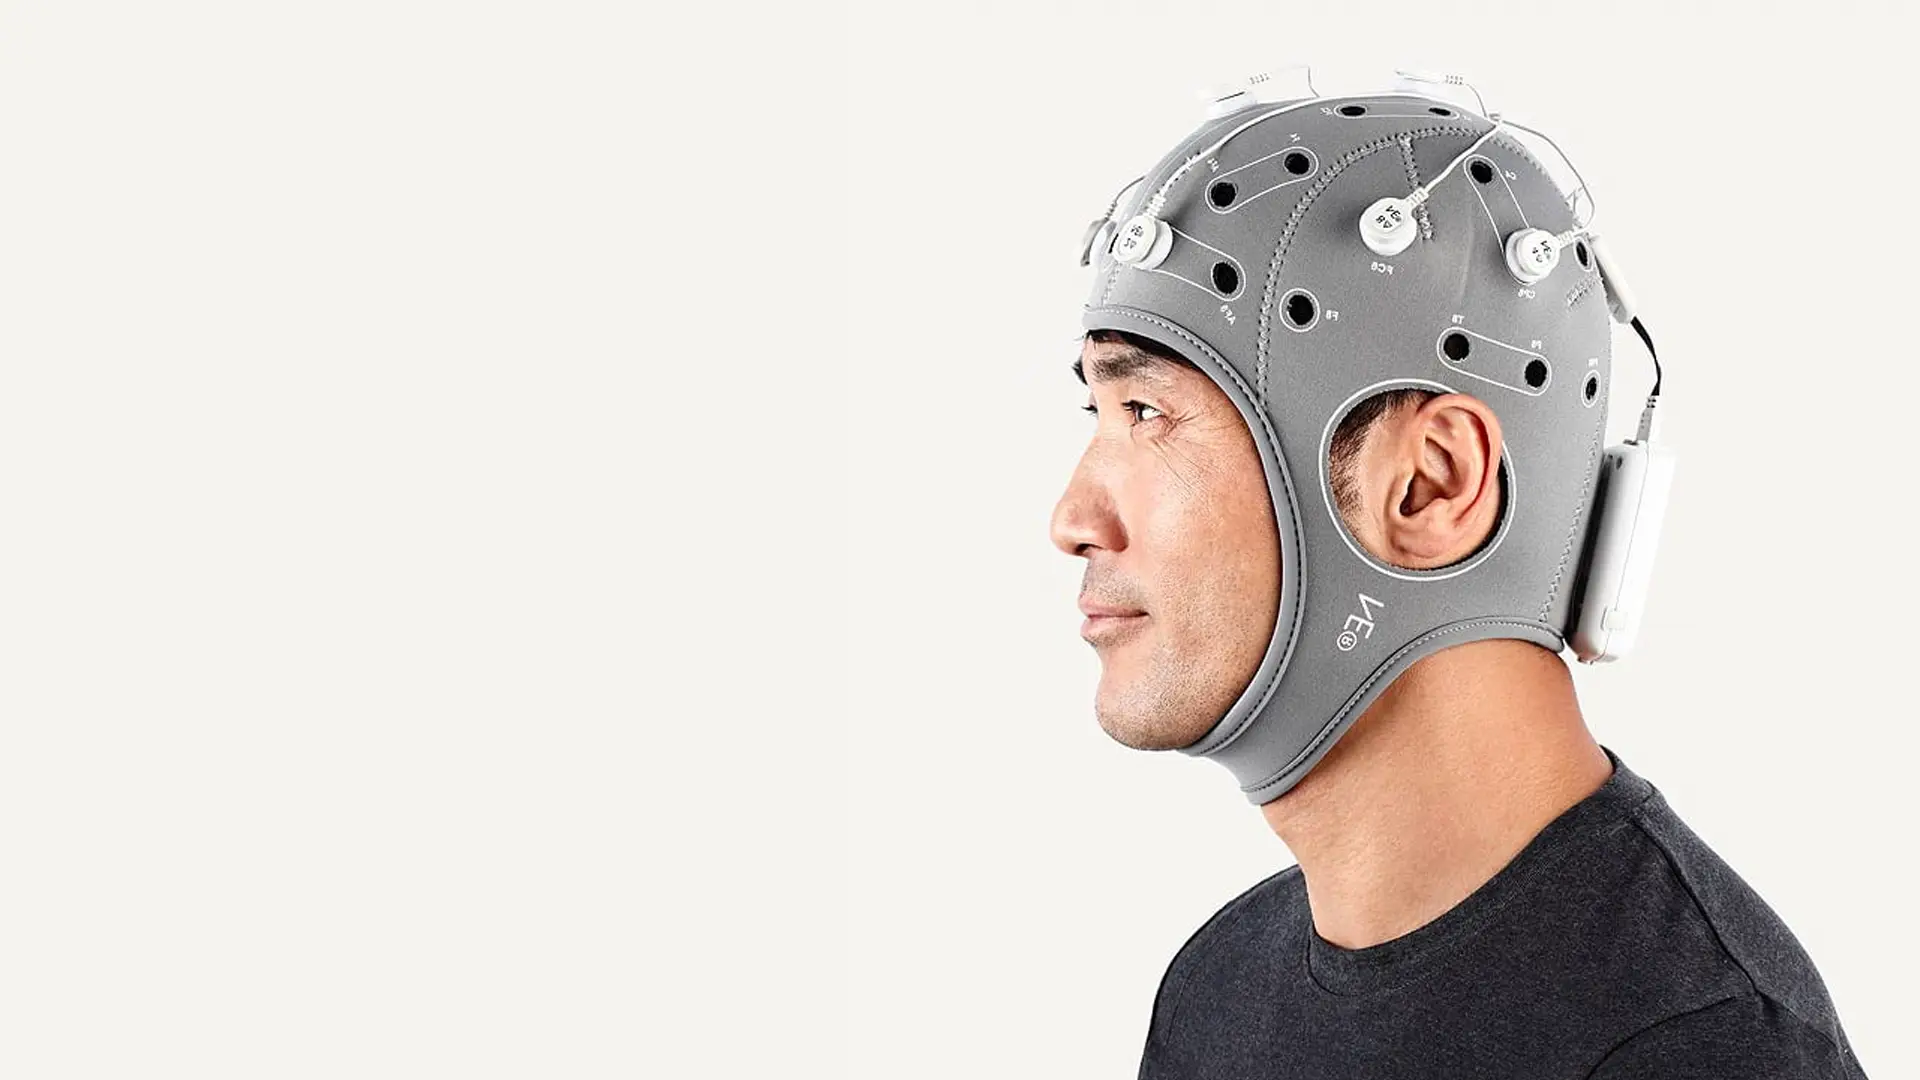
Browse full range of EEG headsets
- EEG headsets from Neuroelectrics, ABM and Brain Products
- Get technical support and guidance in choosing the right equipment
- Full compatibility with iMotions for multimodal research
How EEG measures emotions
One of the biggest advantages with EEG is the capability to collect metrics that are associated with an individual’s inner state – and to gather data about how the brain reacts to stimuli, providing you with truly objective insights.
One of the most validated metrics is “frontal asymmetry” (2-4) – a measure of activity across the frontal hemispheres of the brain. It has been found that increased left-frontal activity (relative to right-frontal activity) is associated with approach motivation, while the converse is associated with withdrawal motivation (5).
This metric can be automatically calculated with iMotions, helping you gather a rapid understanding of participants’ reactions.
Beyond frontal asymmetry, iMotions also allows easy calculation of power spectral density, providing a readout of EEG activity in frequency bands from an EEG recording. By splitting the data into frequency bands (delta, theta, alpha, beta, and gamma), it’s possible to get an overview of the level of brain activity. Read our How to interpret EEG frequency bands for more information.
Beyond these metrics, it’s also possible to gather proprietary metrics from EEG manufacturers, such as ABM’s engagement and drowsiness metrics.
The EEG module provides a great deal of flexibility for collecting data in response to multiple stimulus types. This includes any screen-based stimuli in the form of images, videos, websites, games, software – whether on a desktop, tablet, or mobile phone.
Learn more at: What is EEG and how does it work
With the recent advancements in wireless EEG system, it is now possible to collect EEG data in the wild where the subject can move freely. It should be cautioned that these ambulatory data collections come with inherent restrictions on data signal quality and post-processing overhead, so any ambulatory EEG studies should be carefully considered before undertaking.
Similarly, EEG may also be collected concurrently with Virtual Reality or other head-mounted devices, however potential electronic noise from the devices will need to be accounted for data analysis.
Check out: What is EEG and How does it Work
Export and visualization
Experiments never finish at the data collection stage – analyzing the data allows for hypotheses to be tested and information to be gathered. iMotions allows the data to be exported easily for further analysis if required. Annotation and markup allow specific segments to be selected as desired.
iMotions allows you to choose exactly which sensor data to export together, meaning that while a large amount of data can be collected, the data that you regard as superfluous (for example, the battery amount remaining for an EDA device) need not be exported in the same file. You can, therefore, export the data you need, to do the analyses you’re after.
iMotions: experimental platform
iMotions helps simplify complex EEG research by streamlining EEG data collection and post-processing.
Almost every step in the experimental process is covered in iMotions – from experiment design (stimuli order, participant details, grouping), to stimuli presentation, to data collection, processing, and export.
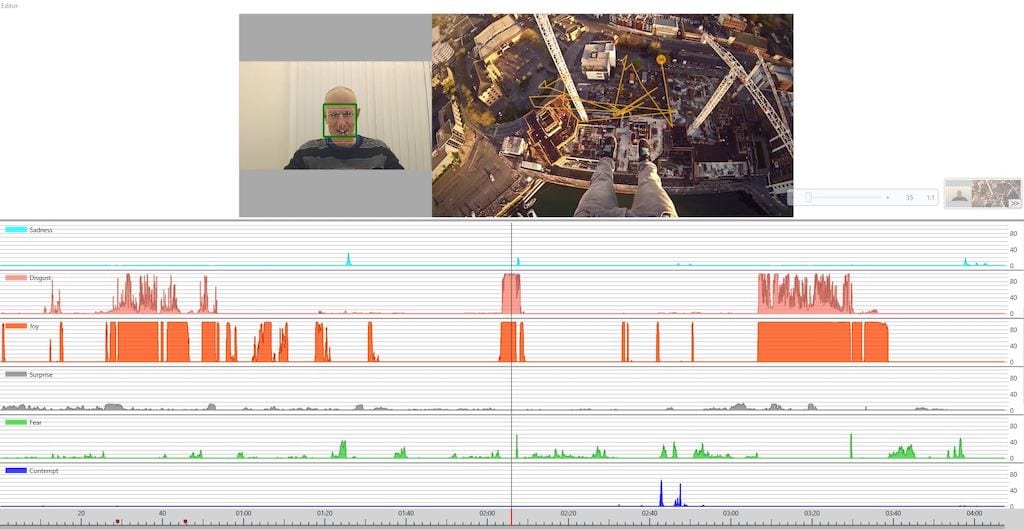
iMotions eliminates the need for multiple computers running different pieces of software. The synchronization ensures that everything can be collected in one place at the same time. This makes the process particularly streamlined and easy-to-run when running experiments with multiple participants.
Further integrations
EEG alone can be limiting but with the help of iMotions, you are able to validate data and dive deeper into the magnitude of emotional responses with a combination of other sensors. iMotions excels at integrations – allowing the connection of multiple, different biosensors in order to create a deeper analysis of human behavior. Biosensors such as eye trackers (screen-based, glasses, and in VR), facial expression analysis, EDA, ECG, and EMG (among others) can be seamlessly included in the experiment.
These sensors can complement the data by providing a depth of understanding that is otherwise missing. The data can provide information about attentional processes, emotional expressions, physiological arousal levels – which are not otherwise not necessarily available when considering EEG data alone.
It’s also possible to connect a variety of other sensors that aren’t natively integrated by using the Lab Streaming Layer (LSL) protocol. This allows data from other sensors to be sent into iMotions and synchronized with other data sources (here is a list of LSL supported devices and tools).
Disclaimer: Make sure you inspect the data quality of your EEG data collected via third-party LSL applications before executing your final study as some of LSL apps may not have been recently tested and may contain bugs that need updating.
Beyond this, it’s also possible to use our open API to connect essentially any other data stream. This can be used to, for example, create brain-computer interfacing, or for biofeedback. Virtually any data-producing device can be connected to iMotions, creating new research possibilities.
Conclusion
The iMotions EEG module provides adaptability and flexibility when it comes to carrying out EEG experiments. As is the case with any research, it’s important to make sure that the software meets your needs – if you’d like to learn more about how this module is (or isn’t) right for you, then reach out and discuss with our experts.
Psychology Research with iMotions
The world’s leading human behavior software
Free 59-page EEG Guide
For Beginners and Intermediates
- Get a thorough understanding of the essentials
- Valuable EEG research insight
- Learn how to take your research to the next level
References
- Perry, E. K. (2010). New Horizons in the Neuroscience of Consciousness. John Benjamins Publishing Company, The Netherlands.
- Coan, J. A., & Allen, J. J. (2004). Frontal EEG asymmetry as a moderator and mediator of emotion. Biological Psychology, 67, 7–50.
- Coan, J.A., Allen, J.J.B., 2003b. Frontal EEG asymmetry and the behavioral activation and inhibition systems. Psychophysiology 40, 106–114.
- Ohme, R., Reykowska, D., Wiener, D., & Choromanska, A. (2010). Application of frontal EEG asymmetry to advertising research. Journal of Economic Psychology, 31(5), 785–793.
- Palmiero, M., Piccardi, L. (2017). Frontal EEG asymmetry of mood: A mini-review. Frontiers in Behavioral Neuroscience, 11, 224. https://doi.org/10.3389/fnbeh.2017.00224.


