
And How to Optimize Structural Equation Modeling with Biosensors.
Structural Equation Modeling (SEM) is valuable for modeling constructs that are not directly observable, such as attitudes or perceptions, by using measurable indicators. This approach is crucial for gaining deeper insights into human decision-making processes, especially when integrating data from diverse sources like surveys and biosensors.
Table of Contents
Structural Equation Modeling (SEM) is a statistical technique that allows researchers to examine complex relationships between observed and latent variables. In the context of, for example, psychoeconomics, SEM is particularly valuable as it integrates multiple constructs to understand human behavior and decision-making processes influenced by psychological and economic factors. Unlike traditional regression methods that assess direct relationships between variables, SEM can evaluate both direct and indirect effects, providing a comprehensive picture of how different factors interplay.
In psychoeconomics, researchers often deal with constructs that are not directly observable, such as attitudes, perceptions, and intentions. SEM helps in modeling these latent variables by using multiple indicators or observed variables that are measurable. For example, to study the impact of financial stress on mental health, SEM can simultaneously account for various aspects like income, spending habits, stress levels, and psychological well-being, thus offering a holistic view of the interactions among these variables.
A Chapter on Variables – How to Use Each in Structural Equation Modeling
Understanding the relationships between the five different types of variables (independent variables, dependent variables, confounding variables, latent variables, and observed variables) is one of the important steps for building accurate and meaningful models.
- Independent Variables (Exogenous Variables):
- These are variables that are not influenced by other variables in the model. They can be thought of as the predictors or causes.
- In SEM, independent variables can influence dependent variables directly or indirectly through other variables.
- Example: Consider a study examining the impact of education (independent variable) on job performance (dependent variable). In this case, education is the predictor that influences job performance.
- Dependent Variables (Endogenous Variables):
- These are variables that are influenced by other variables in the model. They can be thought of as the outcomes or effects.
- In SEM, dependent variables can also act as mediators, influencing other dependent variables.
- Example: In the same study, job performance is the dependent variable affected by education.
- Confounding Variables:
- These are variables that are related to both the independent and dependent variables and can create a spurious association between them if not properly controlled.
- In SEM, confounding variables need to be accounted for to avoid biased estimates of the relationships between the variables of interest.
- Example: In the education and job performance study, health, both mental and physical, could be confounding variables, as they could affect both education levels and job performance.

- Latent Variables:
- These are variables that are not directly observed but are inferred from other variables that are observed (indicator variables).
- Latent variables represent underlying constructs that are hypothesized to cause the observed variables. They are a central concept in SEM and are typically depicted as circles or ovals in path diagrams (see next chapter).
- Examples of latent variables are intelligence, overall satisfaction, or socioeconomic status, family structure etc.
- Observed Variables (Manifest Variables):
- Observed variables, also known as manifest variables or indicators, are directly measured and provide the data used to infer latent variables. These are the actual responses or scores obtained from surveys, tests, or other measurement instruments (biosensors).
- In SEM, observed variables are used to measure latent variables (acting as indicators) and can also serve as independent or dependent variables.
Visualizing Structural Equation Models with Path Diagrams
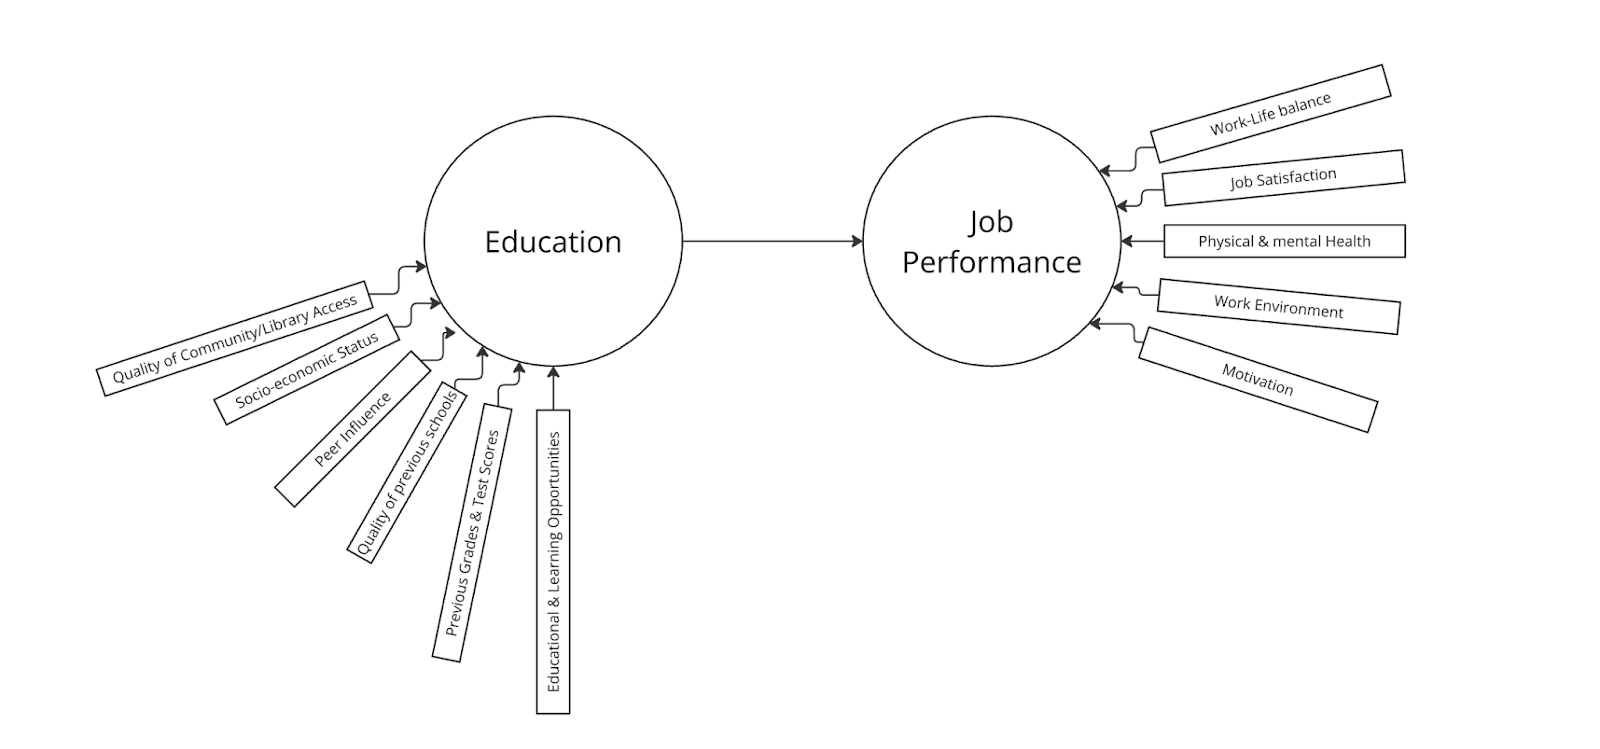
In this example, we have chosen a very simple Path Diagram to showcase how a SEM can be visualized.
To continue the example above, we will stick to looking at the impact Education (Independent variable) has on Job Performance (dependent variable). Now, we could choose to solely study the influence of education, as the predictor, on job performance, as the outcome variable.
However, to get a much more holistic picture, we can also choose to include a number of specifying variables. These variables can be added to evaluate how education and job performance are not just absolute values in themselves, rather there are a myriad of contributing factors at play to encompass a person’s “education” or “job performance”.
A person’s education or educational level can be influenced by factors such as access to a public library (and a desire to use it), extracurricular learning opportunities, demographic factors like quality of nearby schools as well as the socio-economic status of a person’s parents. Previous school performance, usually quantified by test scores, can also factor in, and more difficult to quantify variables such as peer influence can also impact the education level of a person.
These could be individual regressions predicting overall education level. Furthermore, we should also acknowledge that job performance is not just influenced by prior education but conditions and motivations contributing to the evaluation of the job itself, and quantify these to understand how much variance contributing to job performance comes from education alone.
When all these variables are added to the simple Education -> Job Performance model, it could look something like this.
Why use Structural Equation Modeling?
Traditional statistical models typically focus on analyzing the direct effect of an independent variable on a dependent variable. However, these models often fall short in accounting for the numerous moderating and mediating factors that can influence this relationship. To isolate the effect of the independent variable, researchers need to control for as many confounding variables as possible within the study design, which can potentially reduce the study’s ecological validity. Despite this, sometimes it is crucial to include all variables in a comprehensive and interconnected model because they mediate and interact in complex ways.
Journey Towards a Structural Equation Model
Example: Charitable Donation Choices of Millennials
To illustrate the transition towards using Structural Equation Modeling (SEM), consider a study investigating the charitable donation choices of millennials. In a controlled study, researchers might narrow their focus to a specific demographic group, such as individuals aged 35-40, born and raised in Copenhagen, with an income above 70,000 Euros. They would examine if and how these individuals engage in charitable activities.
This focused approach could reveal a linear relationship between an increase in income and the percentage of money spent on charity. However, by broadening the study to include a wider age range and varying income levels, researchers can examine interaction effects between generational differences and income on charitable actions.

When researchers consider other implicit factors, such as societal views, they need to start controlling for these variables or build increasingly complex regression models. For instance, in exploring the charitable choices of a diverse cosmopolitan society like Copenhagen, researchers would need extensive demographic information. This includes age, religious affiliations, political beliefs, social media consumption, personal and family income, relationship status, age of children if any, and field of work.
Using biosensors to enhance structural equation variables
The integration of biosensors into Structural Equation Modeling (SEM) significantly enhances its capability by adding the dimension of Observed Variables. Biosensors provide real-time, objective data on physiological responses such as heart rate variability, skin conductance, and brain activity. These measurements are crucial for understanding the underlying biological processes that accompany psychological and economic behaviors in decision-making processes. By incorporating biosensor data into SEM, researchers can create more accurate and nuanced models. For example, they can explore how physiological stress responses mediate the relationship between economic hardship and psychological distress.
Steps to Implement Biosensors in SEM
Aligning Biosensor Data with Theoretical Constructs
First, researchers need to ensure that the biosensor data aligns with the theoretical constructs of their model. This involves validating physiological measures as indicators of the latent variables of interest. For instance, heart rate variability might be validated as an indicator of stress, while skin conductance could be validated as an indicator of emotional arousal.
Integrating Biosensor Data with Traditional Data
Next, the data collected through biosensors must be integrated with traditional survey or observational data. This requires sophisticated data processing techniques to synchronize and analyze multimodal data streams, a process made simpler by using iMotions, that allows for seamless and real-time synchronization of data-streams from numerous data sources.
For example, researchers might collect survey data on perceived stress levels and simultaneously measure heart rate variability using a biosensor. The challenge lies in ensuring that the timing and context of these measurements are aligned.

Using Structural Equation Modeling to Test Complex Hypotheses
Once the data integration is complete, SEM can be used to test complex hypotheses about the relationships between psychological, economic, and physiological variables. For instance, a researcher might use SEM to test whether financial insecurity leads to increased stress, which in turn causes changes in physiological responses that contribute to mental health issues. Another example could be using an implicit association task to understand social and political preferences, where physiological responses measured by biosensors provide deeper insights.
Advantages of Using Biosensor Data in SEM
By using SEM with biosensor data, researchers can rely on implicit measures and physiological responses rather than solely on self-reported survey measures. This approach provides several advantages:
- Objective Measurement: Biosensors offer objective, real-time data that is not influenced by subjective biases or inaccuracies in self-reporting.
- Rich Data: Physiological data, such as stress measured using ECG or preferences using eye-tracking, enriches the SEM model by adding layers of information that are not easily captured through traditional methods.
- Enhanced Accuracy: Incorporating biosensor data allows for the development of more robust and precise models, leading to a better understanding of the complex interactions between variables.
Example Application
Since this subject can be quite complicated, lets have another example. Consider creating a study exploring the effects of financial insecurity on mental health. Traditional methods might use self-reported data on financial stress and mental health outcomes. By integrating biosensor data, researchers can add observed variables such as heart rate variability and skin conductance to measure physiological stress responses. SEM can then be used to test whether financial insecurity leads to increased physiological stress, which in turn impacts mental health. This holistic approach offers a more comprehensive understanding of the pathways through which financial insecurity affects psychological well-being.
Read more


Free 52-page Human Behavior Guide
For Beginners and Intermediates
- Get accessible and comprehensive walkthrough
- Valuable human behavior research insight
- Learn how to take your research to the next level