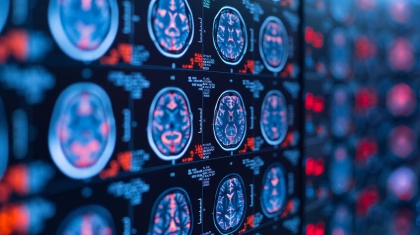
All actions, thoughts, memories, emotions, and experiences of the world are generated by your brain. It is an exceptionally complex organ, both in structure and in function. Whether you are asleep or awake, preparing the next meeting or taking a leisurely stroll around town, your brain is constantly active, absorbing information, interpreting, and integrating it into the existing brain network.
So what is EEG?
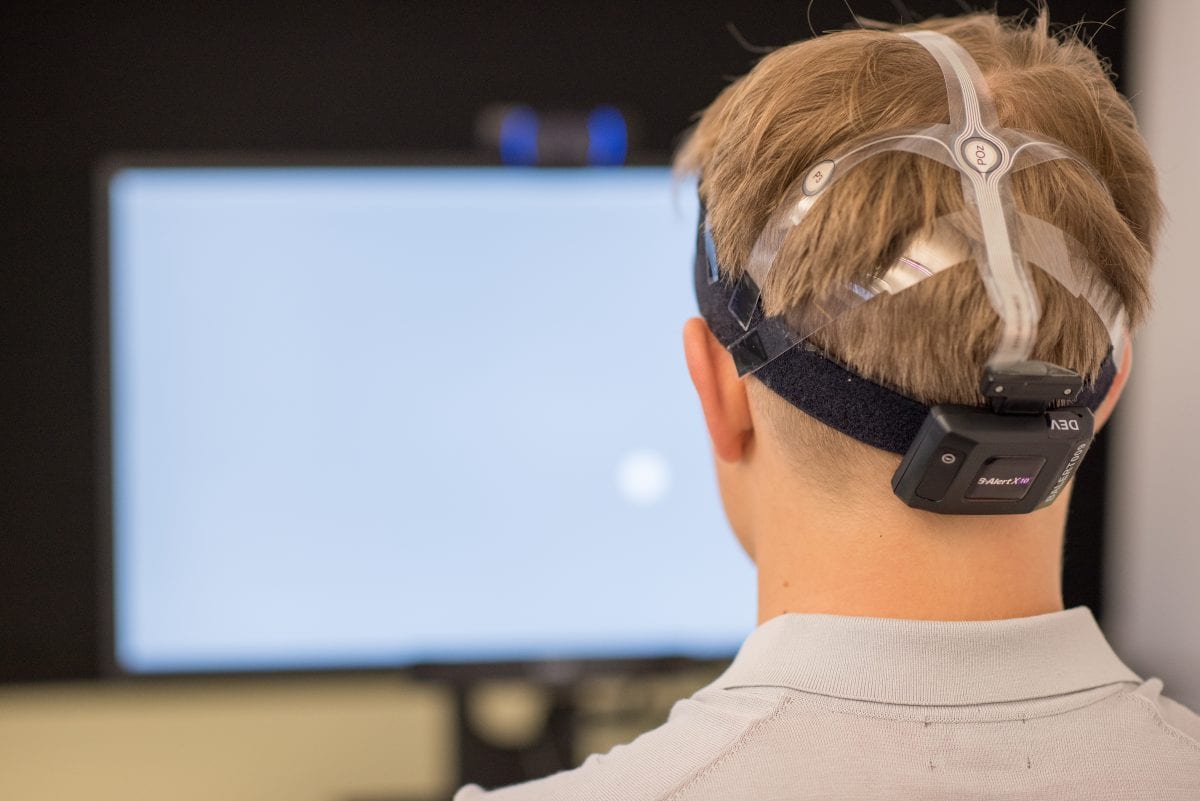
Electroencephalography (EEG), is the technology for recording the electricity generated by the brain from the scalp surface. Applied first to humans in the 1920s by German neurologist Hans Berger, the electroencephalogram records the net sum of all electric fields generated by the brain from electrodes attached to the scalp.
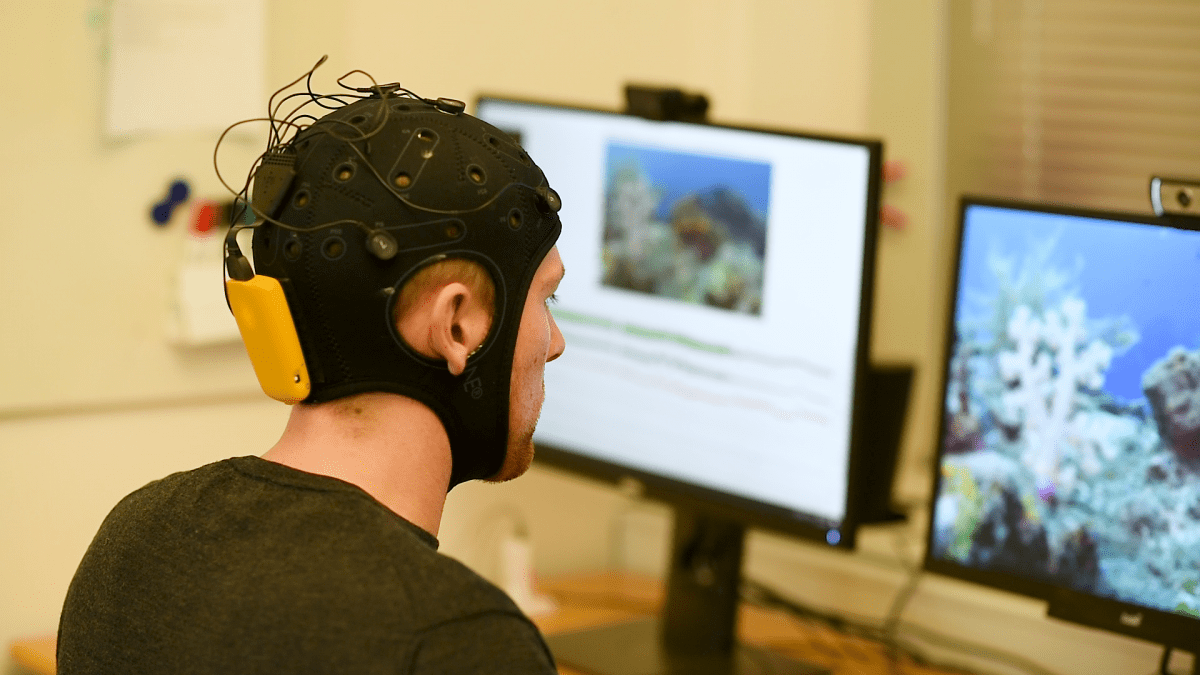
In contrast to other physiological recordings (such as EDA – also known as GSR) which often require only a single set of sensors, EEG recordings are done with electrode arrays, usually comprising various sensor numbers ranging from 10 to 512 electrodes, depending on the scope of the experiment. For faster application, EEG electrodes are mounted in elastic caps, meshes or rigid grids, ensuring that the data can be collected from identical scalp positions across sessions or respondents.
EEG is a relatively inexpensive, non-invasive, and completely passive recording technique. It has an excellent temporal resolution as it can take hundreds to thousands of snapshots of electric activity across multiple sensors within a single second. This makes EEG an ideal candidate to study the signals generated by the brain.
How is EEG applied?
The application range for EEG is extremely wide, ranging from clinical applications (e.g., diagnosis of neurodegenerative brain diseases [1]) to engineering projects (e.g., Brain-Computer-Interfaces [2]), academic human behavior research (e.g., cognitive psychology [3, 4]), to commercial human behavior research (e.g. neuromarketing [5]).
Each of these research areas use EEG to trace electrical signals or from the brain, driven by the firing of neurons.

Browse full range of EEG headsets
- EEG headsets from Neuroelectrics, ABM and Brain Products
- Get technical support and guidance in choosing the right equipment
- Full compatibility with iMotions for multimodal research
Neurons
Neurons, or brain cells, compose a majority of the brain (adults have about 86 billion of them [7]). While there are other cells in the brain that also carry out essential functions, neurons are the principal communicators and these are connections are made via synapses. A synaptic connection is “switched on” during neuronal communication through , which changes the flow of ions across the cell membrane.
This neurotransmission generates a tiny electrical field, which is generally referred to as postsynaptic potential (PSP) [8]. Of course, the PSP of a single neuron might be too small for being detected at all. However, if PSPs occur at the same time for hundreds of thousands of similarly oriented neurons, they sum up and the electrical signal is rapidly conducted throughout brain tissue, skull, and scalp [9]. If enough synchronous activity (from PSPs) is produced, neuronal oscillations can be recorded in which the electrical activity of the brain across a wider region (as compared to single cells) appears increased and decreased in a rhythmic fashion.
EEG signals
Several oscillatory frequencies have been identified which seemingly reflect cognitive or emotional states. These frequencies are delta (0.5 – 3 Hz; associated with slow wave sleep [10]), theta (4 – 8 Hz; associated with drowsiness, idling [11]), alpha (8 – 12 Hz; associated with relaxed wakefulness [12]), beta (13 – 25 Hz; associated with alertness or focused attention [13]), and gamma (> 25 Hz associated with stimulus feature binding and associative learning [14, 15]). While these associations present a picture of associations that each frequency is associated with, there are of course many other cognitive aspects and features that are linked to each.
While at a single-cell level the activity of neurons is highly random, oscillatory patterns emerge when recording through EEG.
Other metrics and signals can be collected from EEG data that give some idea about the functioning of the brain. For example, ERP studies record the brain activity associated with the onset of a stimulus, characterizing the ensuing EEG signal. Some EEG manufacturers offer pre-built metrics that are associated with a certain cognitive state, such as drowsiness, levels of engagement, etc. These are just some examples of the many ways in which EEG data can be analyzed to help inform human behavior research.
The high temporal resolution and relatively straightforward application (as compared to other brain imaging methods such as fMRI) make EEG particularly suitable for such studies that use these metrics or signals to make conclusions about the brain.
This is a brief introduction to the essentials of EEG. To learn more about this technology, and how to use it in research, download our free guide below.
Free 59-page EEG Guide
For Beginners and Intermediates
- Get a thorough understanding of the essentials
- Valuable EEG research insight
- Learn how to take your research to the next level

References
(1) Jeong J. (2004). EEG dynamics in patients with Alzheimer’s disease. Clin. Neurophysiol. 115, 1490–1505. 10.1016/j.clinph.2004.01.001
(2) Wolpaw JR, McFarland DJ, Neat GW, Forneris CA. (1991). An EEG-based brain– computer interface for cursor control. Electroenceph clin Neurophysiol. 78:252–259.
(3) Gotlib, I. H. (2010). EEG Alpha Asymmetry, Depression, and Cognitive Functioning. Cognition and Emotion. 12, 3, 449-478.
(4) Klimesch W. EEG alpha and theta oscillations reflect cognitive and memory performance: a review and analysis. Brain Res Brain Res Rev. 1999;29(2–3):169–95. Epub 1999/04/21. pmid:10209231.
(5) Ramsøy, T. Z., Skov, M., Christensen, M. K., and Stahlhut, C. (2018). Frontal brain asymmetry and willingness to pay. Front. Neurosci. 12:138. doi: 10.3389/fnins.2018.00138
(6) Herculano-Houzel S. (2009). The human brain in numbers: a linearly scaled-up primate brain. Front. Hum. Neurosci. 3:31. 10.3389/neuro.09.031.2009
(7) Azevedo F. A., Carvalho L. R., Grinberg L. T., Farfel J. M., Ferretti R. E., Leite R. E. (2009). Equal numbers of neuronal and nonneuronal cells make the human brain an isometrically scaled-up primate brain. J. Comp. Neurol. 513 532–541. 10.1002/cne.21974
(8) Ashby P., Zilm D. (1982). Characteristics of postsynaptic potentials produced in single human motoneurons by homonymous group 1 volleys. Exp. Brain Res. 47, 41–48. 10.1007/bf00235884
(9) Olejniczak P. Neurophysiologic basis of EEG. Journal of Clinical Neurophysiology. 2006;23:186–189. doi: 10.1097/01.wnp.0000220079.61973.6c.
(10) Braun A. R., Balkin T. J., Wesenten N. J., Carson R. E., Varga M., Baldwin P., et al. . (1997). Regional cerebral blood flow throughout the sleep-wake cycle. An H2(15)O PET study. Brain J. Neurol. 120 (Pt 7), 1173–1197. 10.1093/brain/120.7.1173
(11) Strijkstra AM, et al. Subjective sleepiness correlates negatively with global alpha (8-12 Hz) and positively with central frontal theta (4-8 Hz) frequencies in the human resting awake electroencephalogram. Neurosci Lett. 2003;340(1):17–20.
(12) Laufs H, et al. (2003). EEG-correlated fMRI of human alpha activity. Neuroimage. 19:1463–1476. doi: 10.1016/S1053-8119(03)00286-6.
(13) Niedermeyer, E, & Lopes da Silva, F. H. (2005). Electroencephalography: Basic Principles, Clinical Applications, and Related Fields. Philadelphia, PA. Lippincott Williams & Wilkins.
(14) Başar-Eroglu C., Strüber D., Schürmann M., Stadler M., Başar E. (1996). Gamma-band responses in the brain: a short review of psychophysiological correlates and functional significance. International Journal of Psychophysiology, 24(1), 101–12.
(15) Miltner W.H.R., Braun C., Arnold M., Witte H., Taub E. (1999). Coherence of gamma-band EEG activity as a basis for associative learning. Nature. 397:434–436.