Virtual Reality immersion is more realistic than ever, thanks to advanced biosensors like EEG and GSR. A study comparing VR and 2D experiences reveals higher physiological arousal and engagement in VR, proving its potential for gaming, medical training, and more. Discover how VR enhances immersion.
Table of Contents
In the 1980’s, VR (or virtual reality) was promised to be the next big thing. Now technology has improved and become smaller, faster, and cheaper, VR has actually become the next big thing.
Since Facebook acquired Oculus (a VR hardware producer) for $2.3 Billion in 2014, it has been clear that VR will actually stick around this time. With such a strong backing, and great technological leaps, it’s now a device that everyone wants to get a part of.
There is a rapidly increasing interest and use of VR, with new applications emerging at a similar rate. Whether it’s being used for gaming, education, psychological treatment, or medical training, the immersion offered by the device has been critical to its success. Each new field of use is finding that a portable and immersive experience can be an incredibly powerful thing.
Immersion
But just how immersive is the experience? With such unfathomable sums of money, and so many fields of use involved, there is a great need to quantify and substantiate the claims made by manufacturers and producers who promise the absorbing experience of VR.
This is something that biosensors are fully equipped to take on, both in terms of ease of use, and depth of information. Non-invasive sensors can unobtrusively record physiological information from a participant without causing distraction or discomfort. Such sensors also don’t place any cognitive load on participants, helping them have an effortless experience.
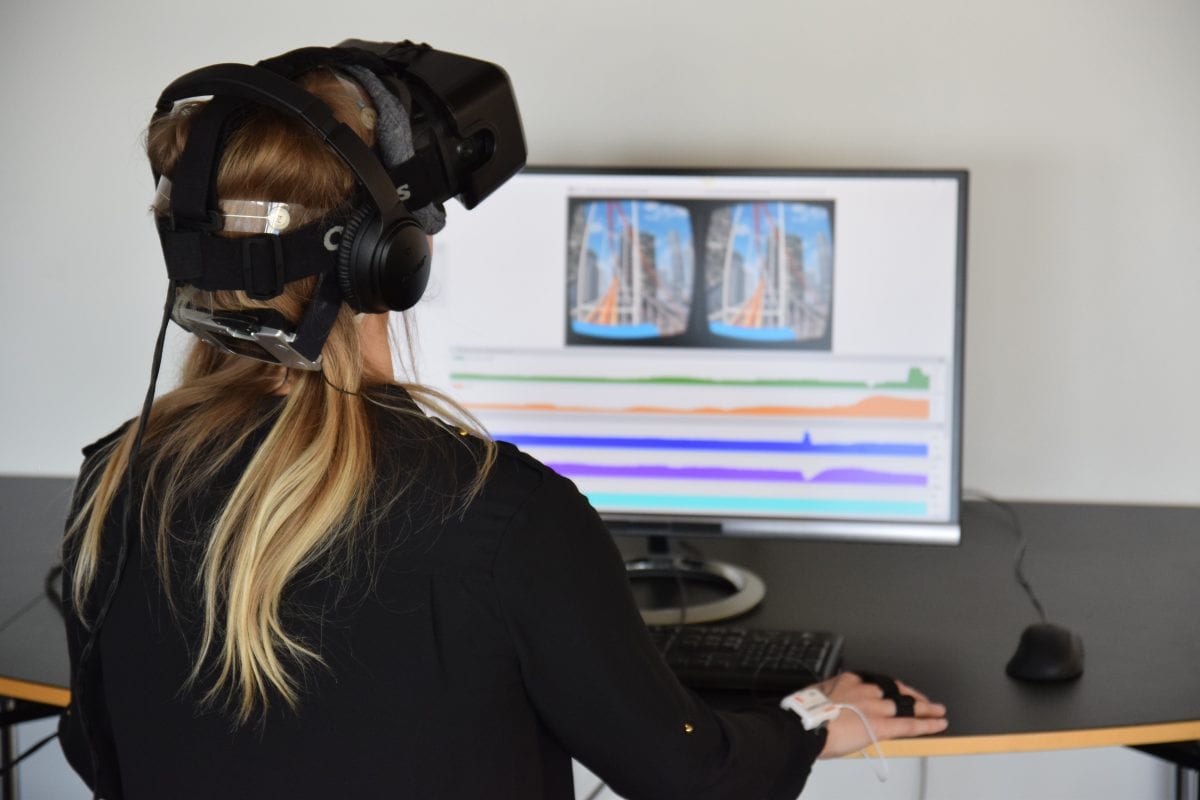
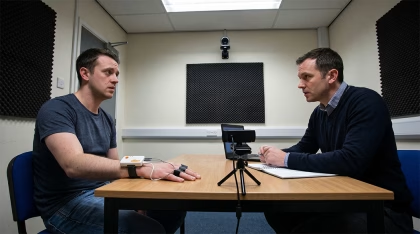
But which biosensors should we use? For the following experiment we chose EEG (electroencephalography, a measure of brain activity), and GSR (galvanic skin response, a measure of electrical activity across the skin). We can see one of our participants in the image above, wearing a VR headset, EEG headset, and a GSR device.
With both of these sensors combined, synchronized and used within iMotions, we can get a robust measurement of the level of physiological arousal that someone is experiencing, and understand how their brain responds too (more about these measures below).
Facial expression analysis would be to put into the mix, but is of course rather difficult to perform with half the face obscured by the VR device, a way around this would be to include fEMG that measure muscle activity through electrodes.
Starting the Test
To test how someone responds to the VR experience, we threw our willing participants (and me) onto a virtual roller coaster, with both a screen-based and VR setup (and thankfully for me, not a real-life setup, although that certainly would have had an impact).
Setting up the experiment is simply a matter of starting up iMotions, importing the video file, and getting strapped into the sensors – all in all it’s about as straightforward as getting onto a roller coaster, just without the queuing (although there is of course some benchmarking to be done before you can begin).

Methods and Measures
The GSR device measures the electrical activity that occurs across the skin. When we think of our palms sweating when we’re nervous – they are. But it’s not just when we’re nervous, but when we are physiologically aroused by anything – if something creates intense feelings of stress or happiness, sadness or surprise, then our sweat glands increase in their activity too. As the sweat glands become more active, this also influences the level of electrical activity across the skin.
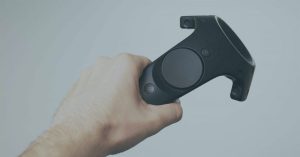
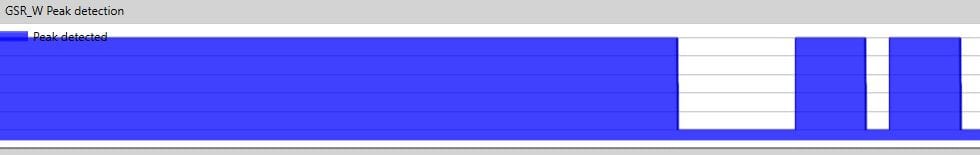
The intensity of emotions can be related to the level of GSR activity, although it can’t tell us which emotion is being experienced. While there is always a certain level of activity – we don’t switch on or off – there are peaks and troughs as the activity changes. It’s the peaks in particular are interesting, that pass a certain threshold, as they can simply be counted and give a number to quantify the level of GSR activity (an example of how the peaks look is shown below).
EEG devices also measure electrical activity, but of the kind that occurs in the brain. Whenever we think, or do anything, and even when we don’t do anything, bursts of electrical activity are fired across the brain. This electrical activity isn’t just part of the brain – it essentially is the brain. EEG offers an insight into this by measuring the voltage changes that occur at the surface.
Through some clever analytics and algorithms, these voltage changes can be translated into more immediately understandable data, such as “motivation / avoidance”, and also “engagement / distraction”, the latter of which we’ll be looking at here.
With these measurements combined, we can make a judgement about how engaging, or distracted, the participant feels when on the virtual roller coaster according to the EEG recordings – and also support the intensity of the feeling through the GSR recordings.
Results
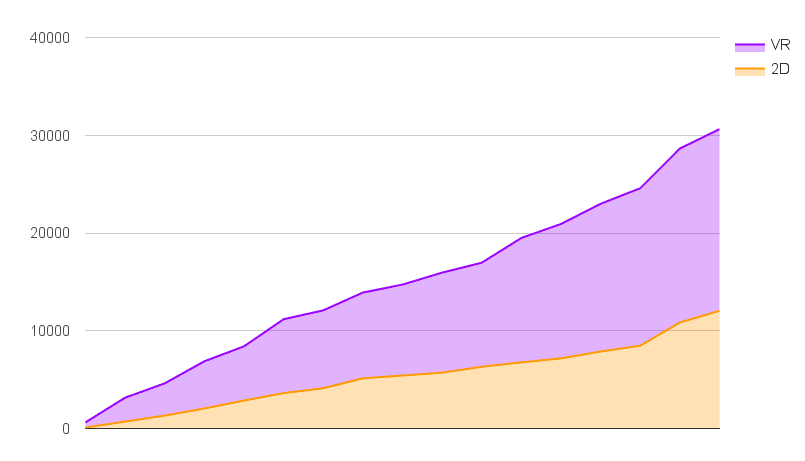
Within iMotions, we can quickly quantify the number of GSR peaks across the two conditions – simply add them up and we can get some idea about the difference in physiological activity that occurs for VR or regular, old, 2D viewings. Of course, this can be difficult to do manually if there are a large number of participants and / or lengthy recording times, which is why computers can be so very helpful sometimes.
The graph below shows the total duration of GSR peaks in milliseconds, as they accumulate throughout the roller coaster ride. This shows a clear and pronounced difference between the two different presentation methods. It appears that VR is at least increasing the intensity of physiological arousal.
Now for the EEG results. The engagement metric is calculated through comparisons of electrical activity in the frontal and central areas, with the parietal lobe (meaning the back and top area of the brain) regions of the brain. If an increase is seen in the frontal and central areas, relative to the parietal lobe, then more engagement of the participant is found.
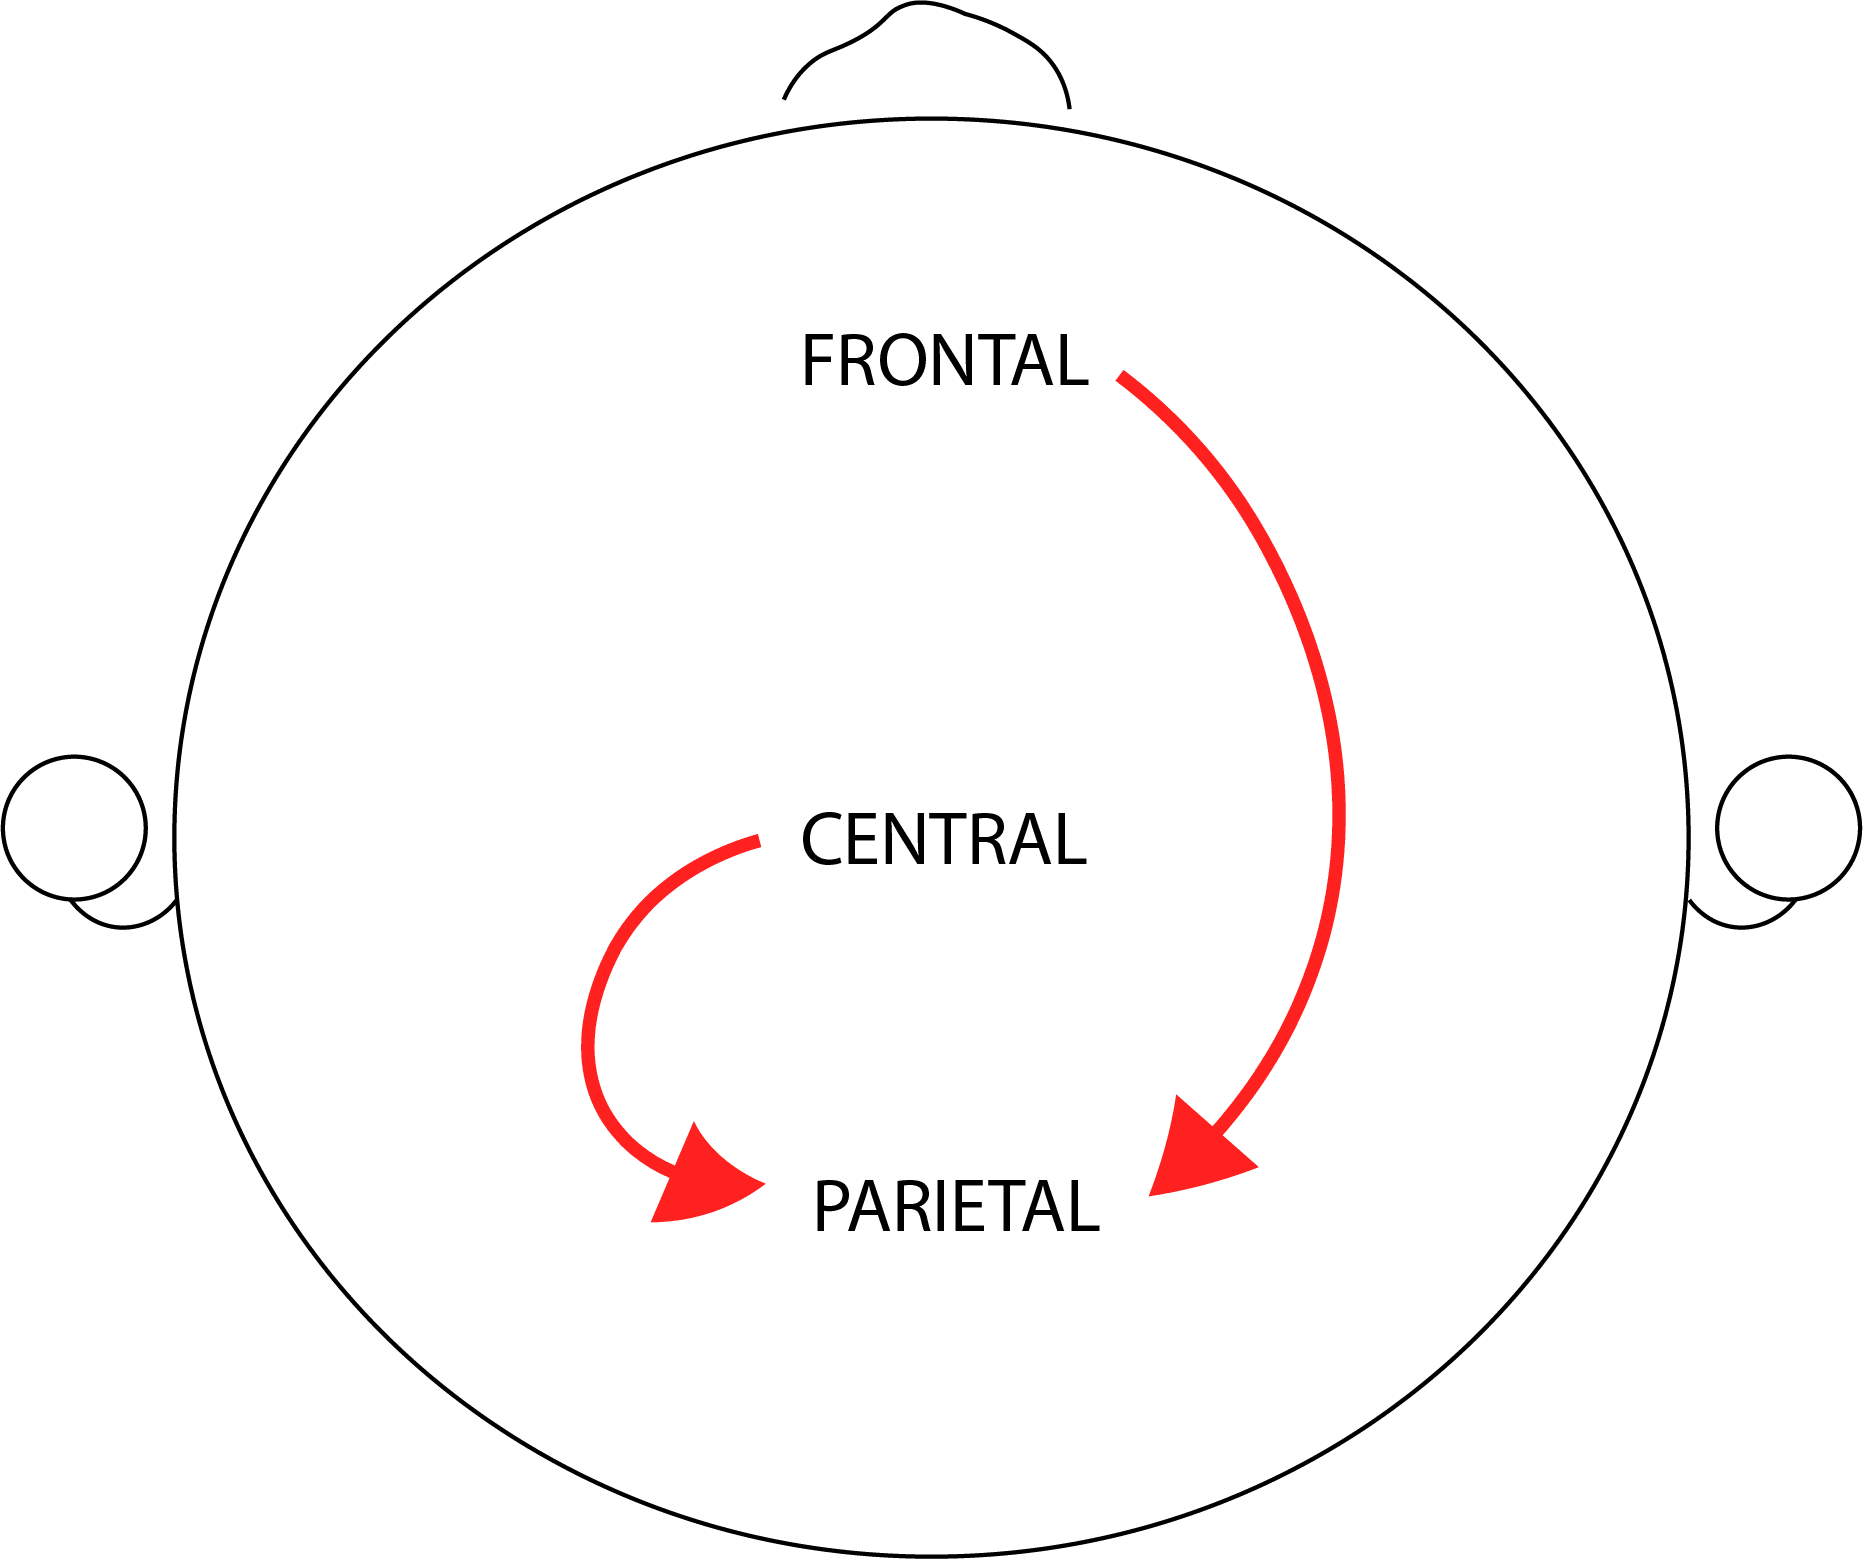
The image shows roughly how engagement is calculated – if more activity is detected by the electrodes at the frontal and central positions, relative to the parietal area, then the person is more engaged in what they are doing.
When we compare the level of engagement for participants in the VR world or the regular world (otherwise known as “everyday life” or “what you’re doing right now”), a clear picture emerges – the engagement is much higher for VR. The graph below shows the mean engagement score, calculated from the above factors (for each participant). Surely a success for the virtual world.
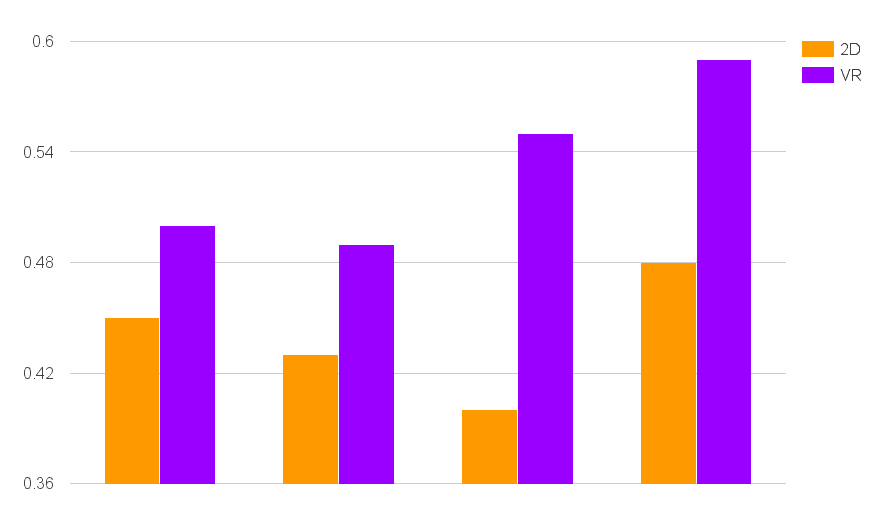
Of course, this doesn’t necessarily mean that VR is better, but it’s certainly more likely to keep someone engaged and excited than watching a video through conventional means (at least when that video is of a roller coaster). This is a thumbs up for VR applications that rely on the immersiveness to increase engagement – medical training, for example, could provide a better learning experience if it is carried out through VR than through a usual online course. Whether or not VR could produce better results than real-life however, is another question for another time.
The measurements themselves could also be used in parallel with the VR headset, to provide a better experience for the user (much in the same way that we are seeing with the integration of eye tracking devices into VR headsets). Combining metrics always provides richer data, and this could help tailor the VR experience further.
This has been our investigation into the immersiveness of VR headsets, by using GSR and EEG measurements. New technologies offer great promise, and iMotions is able to provide the platform to explore how they are impacting us. If you’d like to read more about one of the metrics used here – EEG, then have a look through our guide to read more about the available metrics, and how you can use EEG to understand more about how we think.
Free 59-page EEG Guide
For Beginners and Intermediates
- Get a thorough understanding of the essentials
- Valuable EEG research insight
- Learn how to take your research to the next level
Building on this potential, the iMotions platform empowers researchers to uncover the real-world impact of VR. To see these insights in action through practical applications, delve into our guide on VR Research in Action and real-life case studies using biosensors.
![Featured image for Virtual Reality Immersion Tested: How Biosensors Reveal the Power of VR [A Case Study]](https://imotions.com/wp-content/uploads/2023/01/pexels-eugene-capon-1261824-300x169.jpg)