
If you want to measure where someone is looking or how they visually scan their environment, eye tracking is the best method of choice. As the process of looking is so automatic, this measure is an attractive tool for both qualitative and quantitative research, as it allows researchers to tap into non-conscious processes that are governed by our biases and preferences.
This data can be informative for a wide range of research including psychological or perceptual studies, web design, product preferences, and beyond. Eye tracking is a relatively simple measure in many ways – the tricky part is knowing what to do with the data it provides.
Below we go through 10 of the most common eye tracking metrics, describe how they are made, and summarize what they can tell you.
Table of Contents
1. Fixations and gaze points
When we talk about eye tracking, fixations and gaze points are the basic output measures of interest and often the most used terms.
Gaze points show what the eyes are looking at. If your eye tracker collects data with a sampling rate of 60 Hz, you will end up with 60 individual gaze points per second.
If a series of gaze points is very close – in time and / or space – this gaze cluster constitutes a fixation, denoting a period where the eyes are locked towards an object. Fixations are excellent measures of visual attention, and research in this field has been continually growing.
The eye movements between fixations are generally referred to as saccades. When we read, for example, our eyes don’t travel smoothly. We lock our eyes towards every 7-9 letters (although this of course depends on the font type and size). The term “visual span” refers to how many words we can read before and after the currently fixated word. Trained readers have a higher visual span, allowing them to cover more text with fewer fixations.
By contrast, when we watch a distant car driving by, our eye movements are quite different. Here, we through smooth pursuit, without any saccadic movement. However, there can be catch-up saccades if the object is moving too fast or is too unpredictable.
Check out: Gaze Mapping in Advanced Eye Tracking Research
The amount of fixations or gaze points that are directed towards a certain part of an image (relative to other parts) shows that more visual attention has been directed there. The reasons why this happens can be more difficult to decipher, but it provides a starting point for understanding which aspects of a scene best capture and sustain this attention.
2. Heatmaps
Heatmaps are visualizations which show the general distribution of gaze points. They are typically displayed as a color gradient overlay on the presented image or stimulus. The red, yellow, and green colors represent in descending order the amount of gaze points that were directed towards parts of the image.
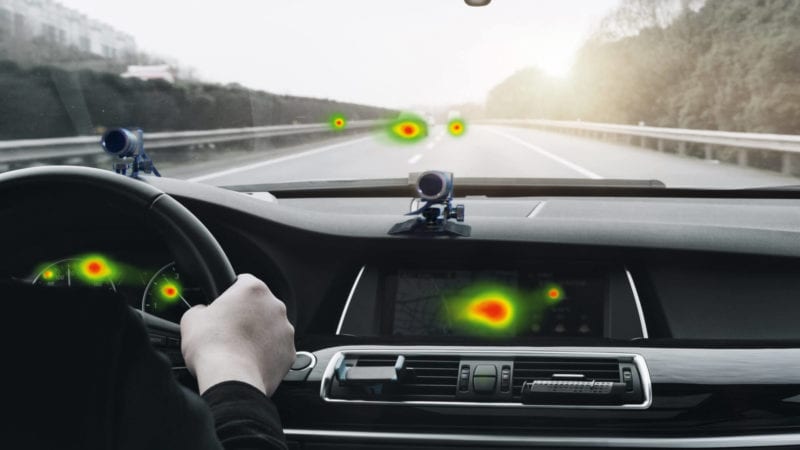
Using a heatmap is a straightforward method to quickly visualize which elements attract more attention than others. Heatmaps can be compared across single respondents as well as groups of participants, which can be helpful in understanding how different populations might view a stimulus in alternative ways.
iMotions software even allows drawing a heatmap for the first 500 milliseconds, which then visualizes the non-conscious processing of attention.
3. Areas of Interest (AOI)
An Area of Interest, also referred to as an AOI, is a tool to select regions of a displayed stimulus, and to extract metrics specifically for those regions. While not strictly a metric by itself, it defines the area by which other metrics are calculated.
For example, if you show a picture of a person, it is possible to draw separate AOIs around the body and the face. You will then be able to display metrics for each region separately, such as how much time passed from stimulus onset until participants looked at the region, how much time your respondents spent in the region, how many fixations were counted, how many people looked away and back.
These metrics come in handy when evaluating the performance of two or more areas in the same video, picture, website, or program interface.

4. Time to First Fixation
The Time to First Fixation (TTFF) indicates the amount of time that it takes a respondent (or all respondents on average) to look at a specific AOI from stimulus onset.
TTFF can indicate both bottom-up stimulus-driven searches (e.g. a flashy company label) as well as top-down attention driven searches (e.g. when respondents actively decide to focus on certain elements or aspects on a website or picture). TTFF is a basic yet very valuable metric in eye tracking, as it can provide information about how certain aspects of a visual scene are prioritized.
5. Time spent (Dwell Time)
Time spent or dwell time quantifies the amount of time that respondents have spent looking at a particular AOI. In some cases, a relative increase in time spent on a certain part of an image could be associated with motivation and top-down attention as respondents refrain from looking at other stimuli in the visual periphery that could be equally interesting.
A long duration of looking at a certain region can indicate a high level of interest, while shorter duration times can indicate that other areas on the screen or in the environment might be more interesting. However, conclusions regarding the emotional reaction to the visual scene cannot be made with eye tracking alone (other measures, such as facial expression analysis, or EEG can help fill in the gaps).
6. Ratio
The ratio provides information about how many of your respondents actually guided their gaze towards a specific AOI. In market research, it might be relevant to optimize an advertisement so that more people are “drawn” towards a specific region in a picture or ad (such as the logo or pertinent product information).
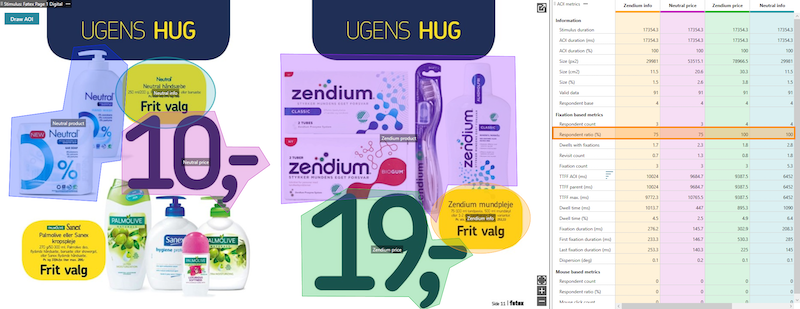
This metric shows which areas of an image draw the most or least attention, and those areas that weren’t attended to at all. Collecting data about the ratio of gazes across groups could reveal which portions of the image were more attractive to different participants.
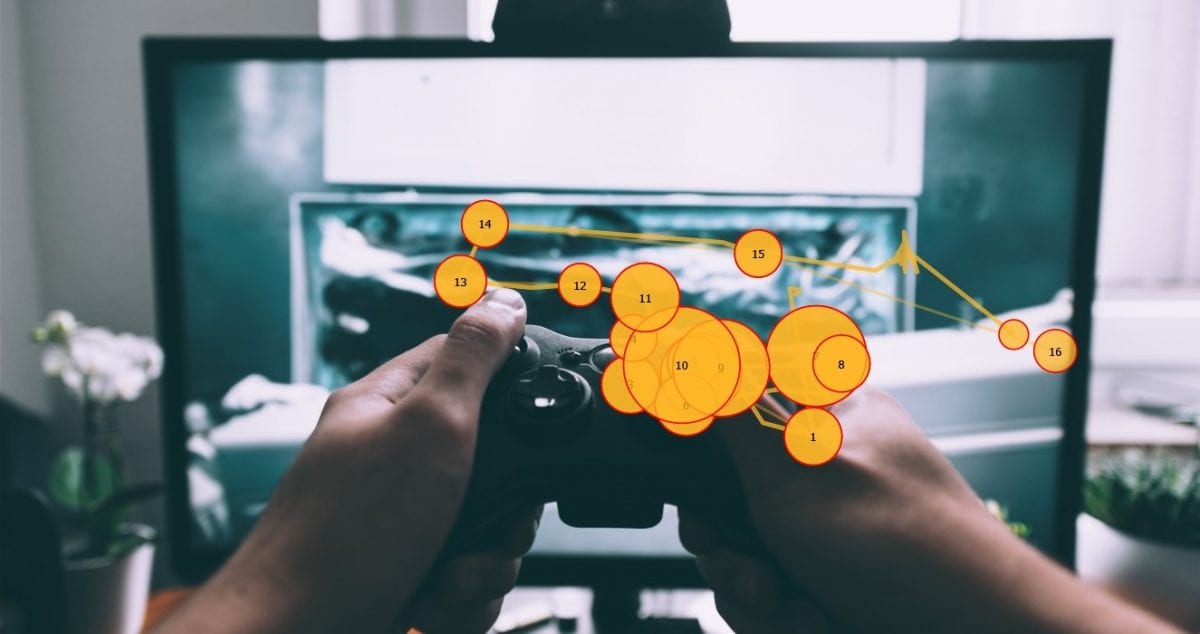
7. Fixation sequences
Fixations sequences are based on both spatial and temporal information – when and where a participant looked. This allow a picture to be built up of what is prioritized by a participant when they see a visual scene. This will often begin in the middle of the image due to the central fixation bias, but the following viewed components will be representative of what is most motivating to look at for the participant(s).
Order of attention is a commonly used marker in eye tracking research, as it reflects a person’s interest as well as salient elements in the display or environment (i.e. elements that stand out in terms of brightness, hue, saturation etc.).
Last fixation is often found to be more predictive of choice in financial decision tasks (choosing option A over option B/C/etc) [1] .
Though, one caveat with the last fixation being more predictive of choice, often coincides with experimenters knowing about left/right and top/bottom reading bias. Most languages tend to read from top left to bottom right.
So if items in the visual fields are often randomized across repeated trials so first fixations aren’t really predictive of behavior (due to this manipulation). In the real world, more often than not, it seems like good marketers/designs will be aware of these visual biases so they can potentially manipulate things so first fixations matter.
Check out: How We Read – What Eye Tracking Can Tell Us
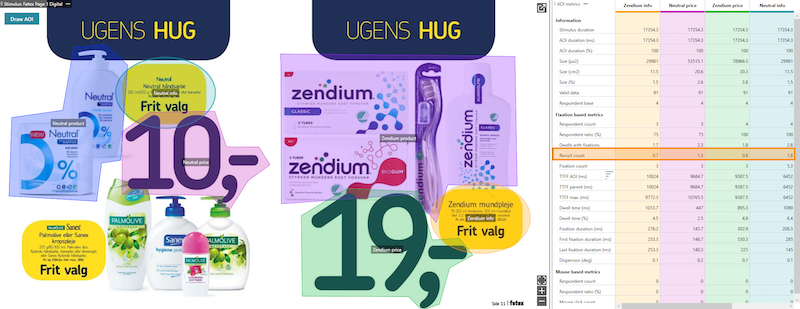
8. Revisits
The number of revisits provides information about how many times a participant returned their gaze to a particular spot, defined by an AOI. This allows the researcher to examine which areas repeatedly attracted the participant (for better or worse), and which were seen, but were then moved on from.
The participant may be drawn to a particular area of an image because it’s pleasing, because it’s confusing, or even because it’s frustrating. While eye tracking cannot tell you how someone felt while looking at something, it can provide you with data about what should be examined further.
9. First Fixation Duration
As we explore a visual scene with our eyes, we move across through saccades, before settling on a part of the image by fixating. The first fixation duration provides data about how long that first fixation lasted for.
This can be particularly valuable when used alongside TTFF, as an indicator of how much an aspect of the scene initially attracted attention. If a participant has a short TTFF, and a long first fixation duration, the area is in all likelihood very eye-catching.
This is also useful as obtained from an AOI, as it provides information about how long the first fixation at a certain region lasted for, which can be compared to other regions. This can be useful in determining the first impressions of AOIs.
10. Average Fixation Duration
The average fixation duration tells you how long the average fixation lasted for, and can be determined for either individuals or for groups. This can be helpful as a baselining measure in either case, but can also be interesting to look at across stimuli.
If one image leads to a much higher average fixation duration than another, then it could be worthwhile exploring the reasons why. Furthermore, comparisons across AOIs allow you to determine which areas were actually focused on more than others. If you’re trying to convey a message, it’s most likely that you’ll want the average fixation duration to be higher within the areas that feature that message, relative to other areas.
All of the above metrics are calculated and provided as standard by iMotions when analyzing eye tracking data, with any of the 30+ eye trackers that iMotions integrates with. If you’d like to learn more about these metrics, then download our 32 page guide below.
Note: this is an updated version of an article (originally published July 9th, 2015) that previously featured seven eye tracking metrics.
References
[1] Ian Krajbich, Carrie Armel & Antonio Rangel. Nature Neuroscience volume 13, 1292–1298 (2010); published online 12 September 2010; corrected after print 10 February 2011