Explore how heart activity can be measured using two widely adopted biosignal techniques: electrocardiography (ECG) and photoplethysmography (PPG). By comparing these approaches, the discussion highlights how different measurement strategies can capture the same underlying cardiac cycle with varying levels of precision, complexity, and practical applicability. The broader aim is to clarify how physiological signals are translated into meaningful indicators of arousal and behavior in research settings, and how these measures contribute to a more complete understanding of human response.
Table of Contents
Out of all human organs, the heart is one of the most awe-inspiring. It must continuously and reliably pump blood throughout the body for an entire human lifespan. At an average of 79 years, this equates to roughly 3 Billion heartbeats that play out in an intricate dance of contraction and relaxation.
In order to measure the cardiac cycle and obtain heart rate measures, multiple sensor-based techniques exist. The two most widely used methods are electrocardiography (ECG, also known as EKG), and photoplethysmography (PPG). While iMotions supports the use of both, there are benefits and drawbacks to each approach that should be considered depending on the type of research being performed.
ECG
Electrocardiography measures the electrical activity of the heart by using electrodes placed on the skin. For the heart to contract and pump blood, a series of coordinated electrical signals are sent to the heart by the autonomic nervous system.
Despite occurring deep within the body, these signals can be measured at the skin level quite effectively using two or more electrodes placed in various positions on the chest and limbs. What results is a highly informative pattern of electrical activity called the ECG wave.
Although there are many aspects of this signal that can be quantified, the most prominent feature is known as the QRS complex, which indicates the main pumping contractions of the heart. This feature is shown in the image below:
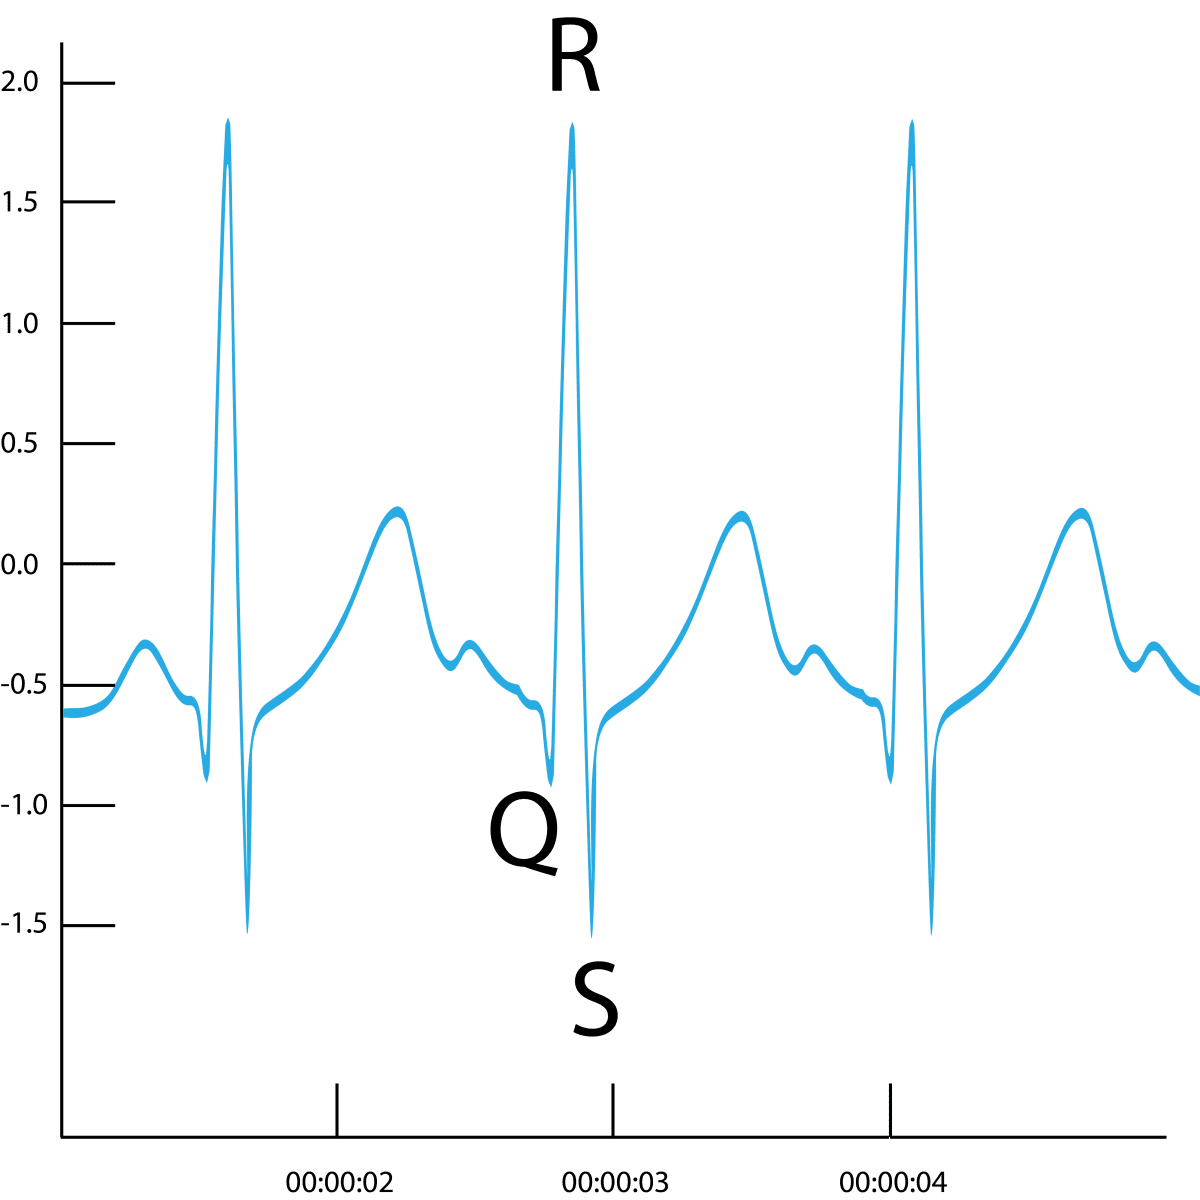
The QRS complex. Each letter shows a different location of the signal, and therefore a different action of the heart. The R peak is the largest amount of electrical activity produced by the heart, and is commonly used in measurements of heart rate.
Within the QRS complex, we can also see the R peak – the most prominent component within the ECG waveform. This is what is used by heart rate algorithms to measure the amount of time that occurs between each pulsing heartbeat.
Because electrical signals travel pretty much instantly, ECG based measurements are generally accurate within a couple of milliseconds, making it a highly reliable measure of heart rate.
PPG
Photoplethysmography measures the volumetric change of the heart by measuring light transmission or reflection. As the heart contracts, blood pressure within the left ventricle – the main pumping chamber – increases.
This increase forces a pressurized “pulse” of blood into the arteries of the body, which causes them to swell slightly before once again returning to their previous state.
By simply shining a light on a patch of skin with an LED light source, the increased pulse pressure will cause a measurable difference in the amount of light reflected back onto or transmitted through to a light sensor. The LED light should be placed in an area where arteries are close to the skin, such as a fingertip, or an earlobe.

The amplitude of this signal is directly proportional to pulse pressure – the higher the peak, the stronger the pulse. Even though the signal can be less apparent if measured on the skin at a point far from the heart (such as a toe), the change in pressure is still enough to expand these arteries to a degree that is measurable.
Each peak in the resulting signal can be identified by a special heart rate algorithm that can ultimately determine the amount of time that occurs between each successive peak – giving another measure of heart rate.
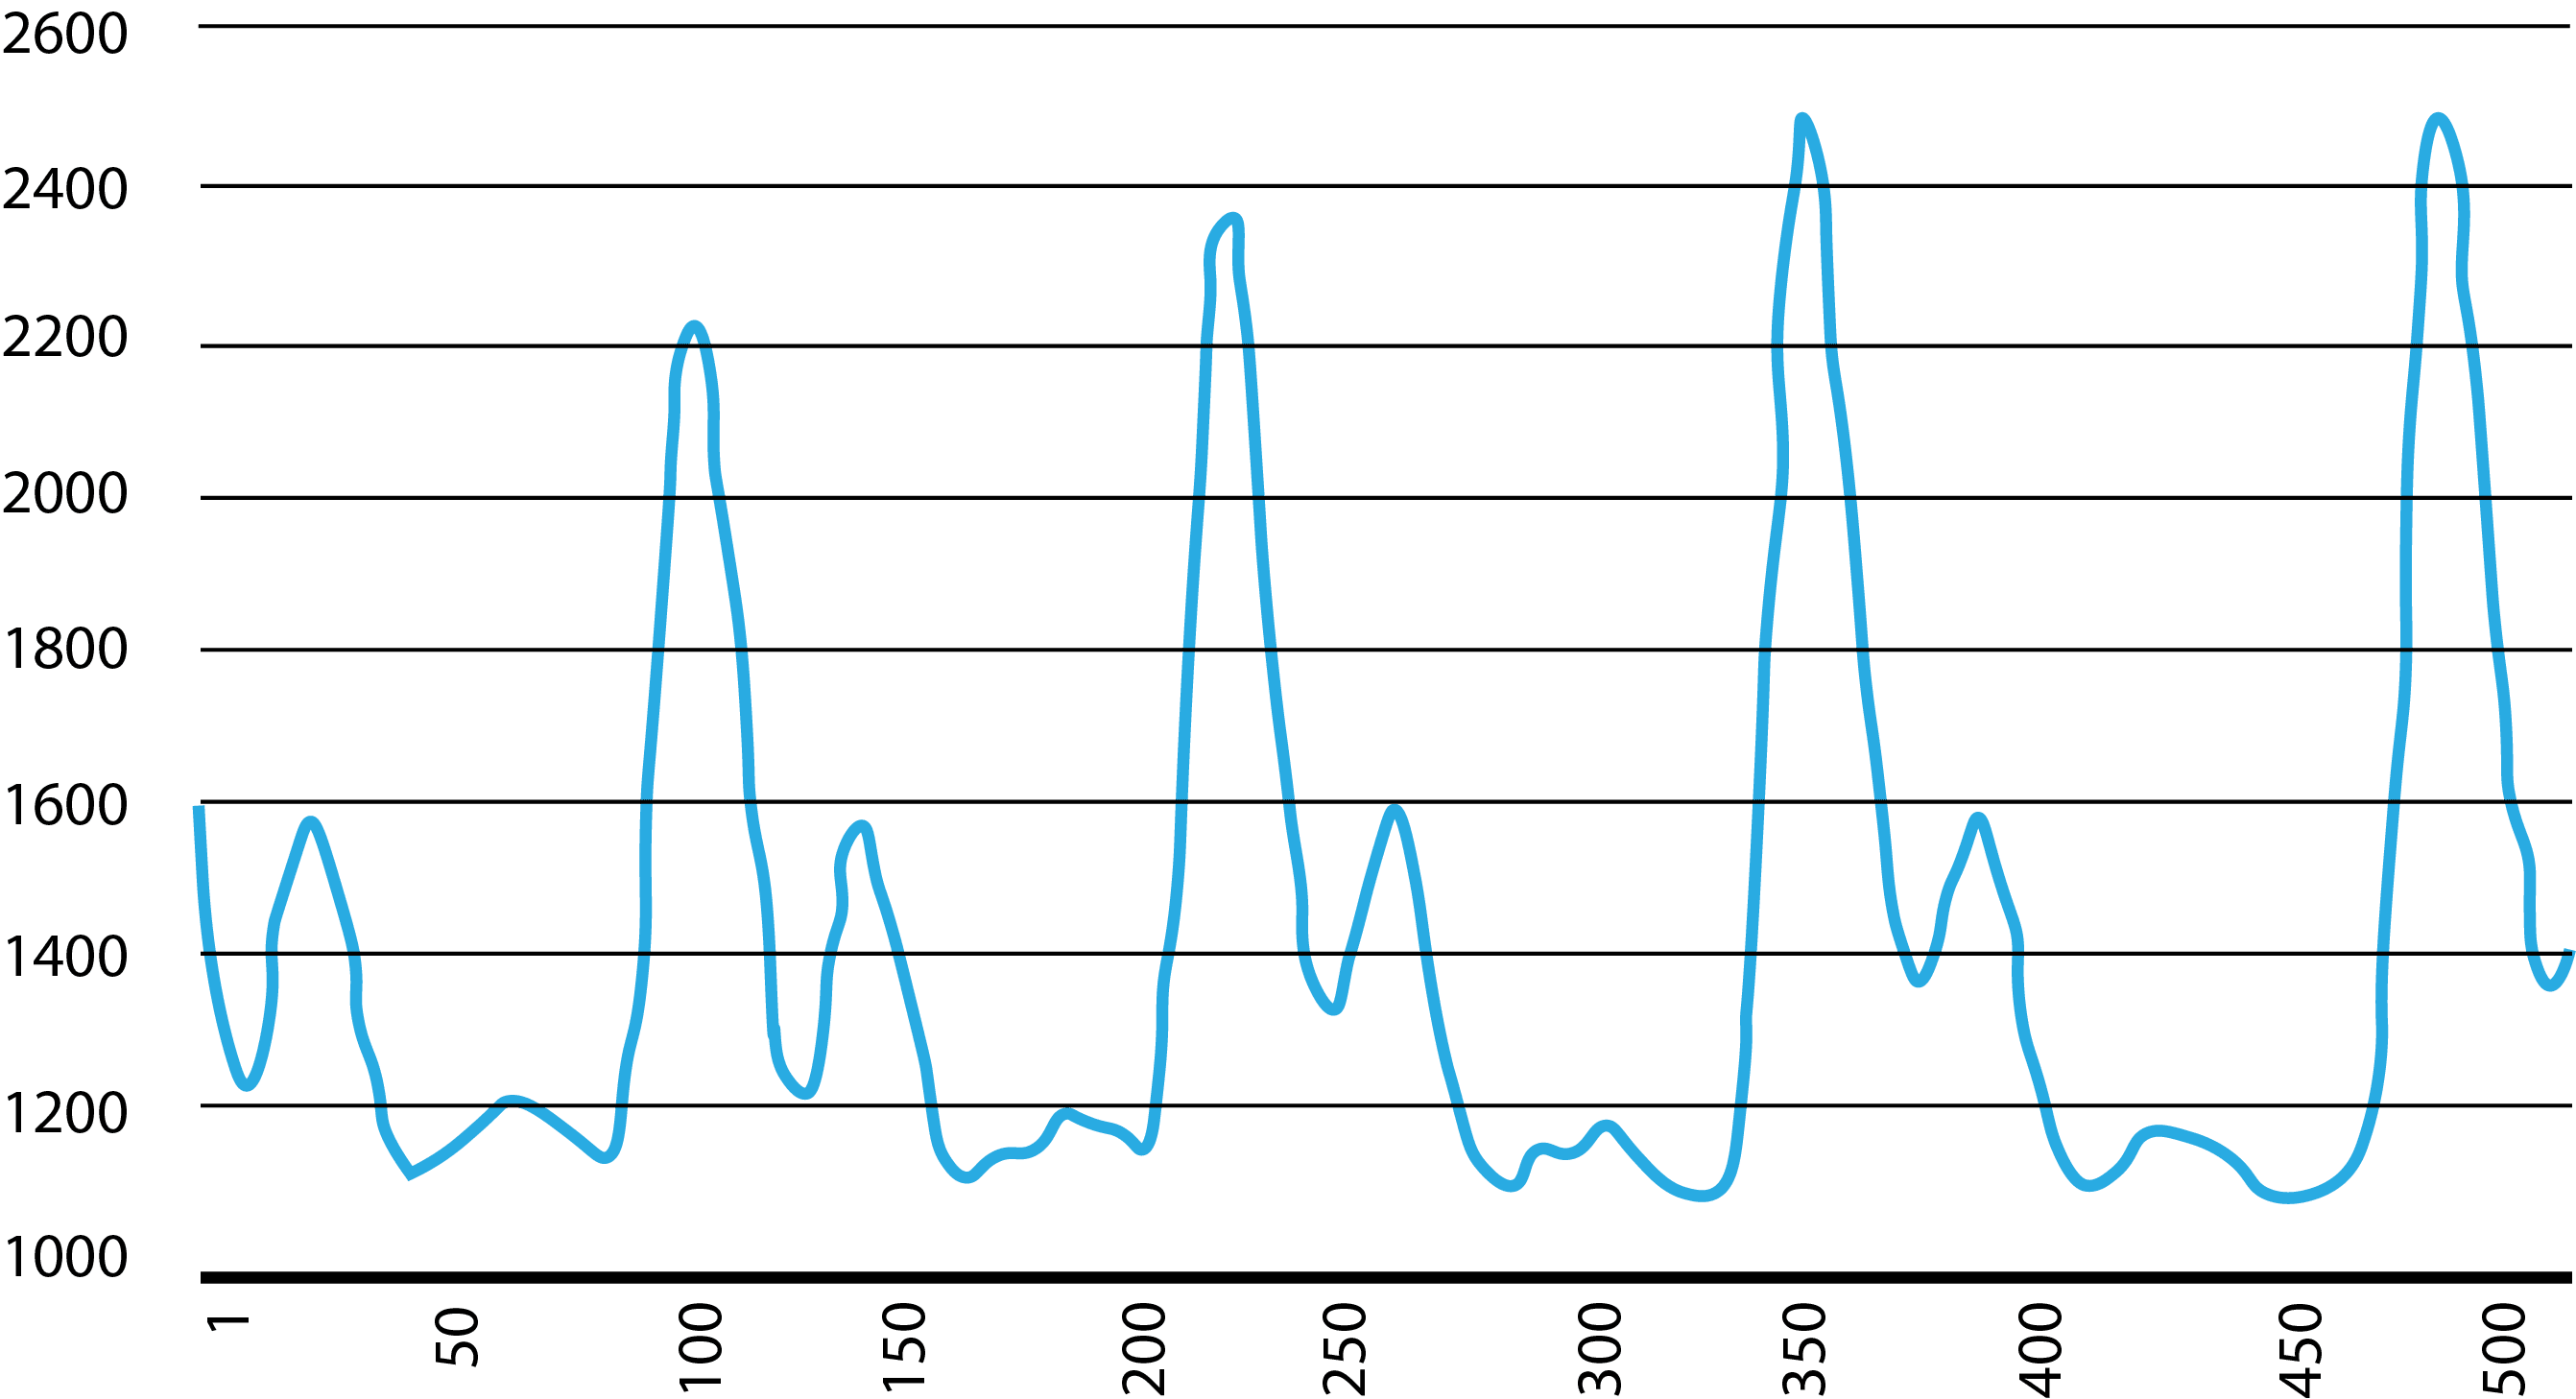
An example of a typical PPG signal, showing the difference in size of the blood flow.
Because PPG is an indirect technique (that doesn’t record the heart’s true activity occurring at its source), it is not always accurate to the millisecond level, yet is an easily applied way in which to measure an individual’s heart rate.
Conclusion
Both ECG and PPG provide measurements of heart rate, and can therefore provide information about the level of physiological arousal that someone is experiencing. With this information, research can help build a picture of how certain stimuli affect an individual (for example, does heart rate increase when shown a picture of a snake, or a spider? What about a product they like?).
If the stimulus increases heart rate, and therefore arousal, then the image can be said to have an affect on the person – it tells you how much of an impact, but doesn’t tell you exactly how they are feeling. Combining these measurements of arousal with measures of emotional valence can multiply the impact of these results, and tell you exactly how it made someone feel, as well as how strongly.

By using facial expression analysis alongside ECG or PPG, it’s possible to understand the emotional state of a participant, and also how strong their physiological reactions are. By combining further with eye tracking, it’s possible to know exactly what someone is looking at as well as their arousal and valence.
The use of these measurements in parallel provides a truly multi-dimensional understanding of human behavior, giving insights like never before. That should be enough to get your heart racing.
We hope you’ve enjoyed learning about the mechanisms underlying ECG and PPG, and how they can be used in your research. If you’d like to know more about how to carry out amazing human behavior research, then download our free guide below.
Free 52-page Human Behavior Guide
For Beginners and Intermediates
- Get accessible and comprehensive walkthrough
- Valuable human behavior research insight
- Learn how to take your research to the next level