
Discover how to choose the right statistical test for your research with a clear, practical guide to data analysis. This blog walks through key methods—from t-tests and ANOVAs to correlation and regression—helping you match your experimental design with the correct statistical approach so you can confidently turn raw data into meaningful, reliable insights.
Table of Contents
Carrying out research is a series of processes. Planning the experiment, designing the participant groups, setting up the study, and collecting the data are all critical to carrying out scientifically valid research. One particularly challenging aspect of the research process is the data analysis step; Specifically, it takes time and patience to know what the appropriate statistical test is for evaluating your data.
To help with this process, we have a variety of resources available, from our experimental design guide (available below), to guidance for statistical analysis tools, as well as several built-in analytical tools available in our software. To complement these, we’ve also built the chart below to help you carry out the statistical test you need to best determine the results of your experiment.
The graphic below provides a quick guide to selecting the most appropriate method among common statistical tests:
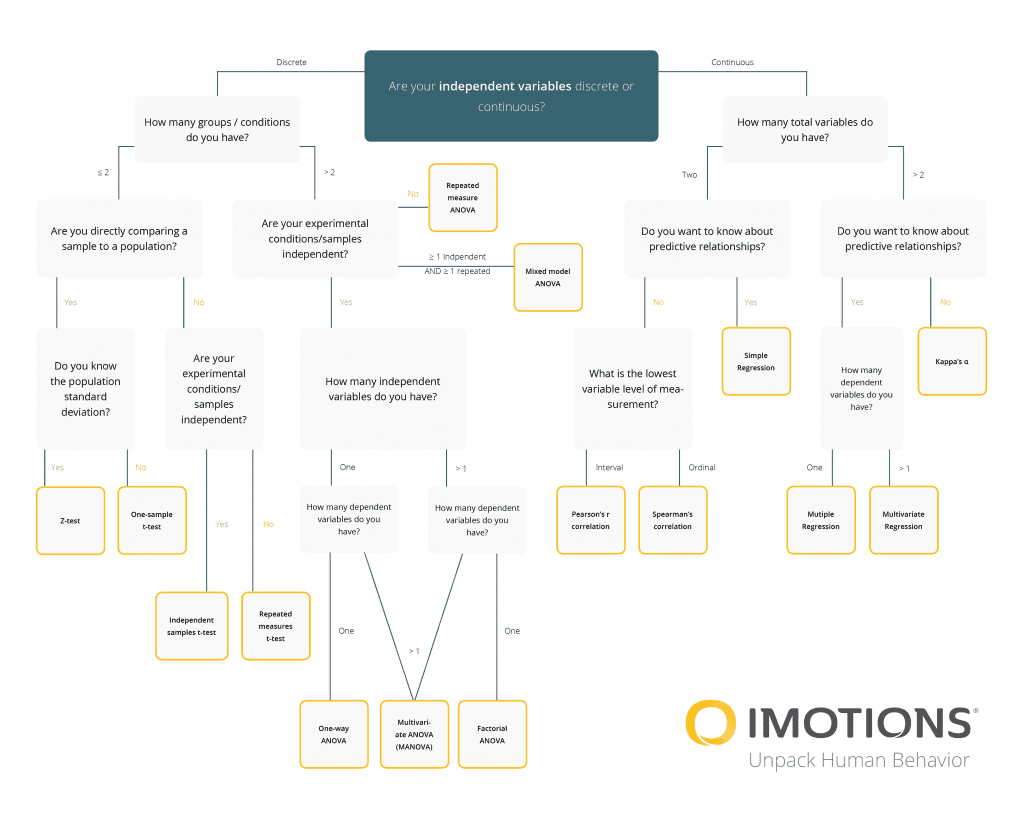
Armed with this flowchart for guiding your choice of statistical test, you should be able to take confident steps towards the final stage of your experiment.
Different Statistical Tests:
Discrete Independent Variable
A discrete variable is a variable whose value is obtained by counting
- Examples: How many shoppers are present in your store, How many students are in the lab,
Z-test
Z-test tests the mean of a distribution.
- Questions to ask: If you have more than 2 groups or conditions > Are you directly comparing a sample to a population? Do you know the population standard deviation?
One Sample t-test
The One Sample t Test is a parametric test and can only compare a single sample mean to a specified constant.
- Questions to ask: If you have more than 2 groups or conditions >Are you directly comparing a sample to a population? You Do NOT know the population deviation
Independent Sample t-tests
Independent Samples t-Test (to compare the means of two groups)
- Questions to ask: If you have more than 2 groups or conditions >Are you are NOT directly comparing a sample to a population? Your Experimental conditions/samples are independent
Repeated t-tests (paired t-tests)
The Repeated t-test or paired sample t-test, sometimes called the dependent sample t-test, is a statistical procedure used to determine whether the mean difference between two sets of observations is zero.
- Questions to ask: If you have more than 2 groups or conditions >Are you are NOT directly comparing a sample to a population? Your Experimental conditions/samples are NOT independent
Repeated measure ANOVA
Repeated measure ANOVA is the equivalent of the one-way ANOVA, but for related, not independent groups, and is the extension of the dependent t-test
- Questions to ask: Your groups/conditions are less than 2, Your experimental conditions and samples are NOT independent
Mixed Model ANOVA
A mixed model ANOVA is a combination of a between-unit ANOVA and a within-unit ANOVA. It requires a minimum of two categorical independent variables
To see how these concepts are applied in practice, explore our Talk to a Research Expert page.
One-way ANOVA
The one-way analysis of variance (ANOVA) is used to determine whether there are any statistically significant differences between the means of two or more independent (unrelated) groups
- Questions to ask: Your groups/conditions are less than 2, Your experimental conditions and samples are independent, You have one dependent variable
Multivariate ANOVA (MANOVA)
Multivariate analysis of variance (MANOVA) is a procedure for comparing multivariate sample means. As a multivariate procedure, it is used when there are two or more dependent variables
Factorial ANOVA
A factorial ANOVA is an Analysis of Variance test with more than one independent variable, or “factor“. It can also refer to more than one Level of Independent Variable.
With a grasp of these powerful analytical techniques, the next step is efficiently putting them into practice. To truly make your data shine and ensure precise, actionable insights, explore our guide on The Top 7 Statistical Tools You Need to Make Your Data Shine.
Continuous Independent Variable
A continuous variable is a variable whose value is obtained by measuring
- Examples: Weight of participants, the time it takes to complete a task, the distance it takes to walk to a target destination
Pearson’s r correlation
Pearson’s correlation coefficient (r) is a measure of the strength of the association between the two variables.
Spearman’s correlation
Spearman’s correlation is a nonparametric measure of rank correlation (statistical dependence between the rankings of two variables). It assesses how well the relationship between two variables can be described using a monotonic function.
Simple Regression
Simple regression analysis is a set of statistical processes for estimating the relationships between a dependent variable (often called the ‘outcome variable’) and one or more independent variables (often called ‘predictors’, ‘covariates’, or ‘features’).
Multiple Regression
In multiple linear regression, there are several independent variables or functions of independent variables.
Multivariate Regression
Multivariate regression is a technique that estimates a single regression model with more than one outcome variable. When there is more than one predictor variable in a multivariate regression model, the model is a multivariate multiple regression.
Kappa’s a
Cohen’s kappa statistic measures interrater reliability (sometimes called interobserver agreement). Interrater reliability, or precision, happens when your data raters (or collectors) give the same score to the same data item.
Free 44-page Experimental Design Guide
For Beginners and Intermediates
- Introduction to experimental methods
- Respondent management with groups and populations
- How to set up stimulus selection and arrangement
To learn more about carrying out great research, from beginning to end, download our free guide below.