Discover how combining surveys with behavioral data uncovers hidden preferences, showing not just what people report liking, but what truly captures their engagement in the moment—and how different audiences respond in surprisingly different ways.
Table of Contents
What makes a person choose one pizza menu over another? Is it the food itself, or the feeling the brand evokes? We ran an eye-tracking study to find out, and the results might surprise you
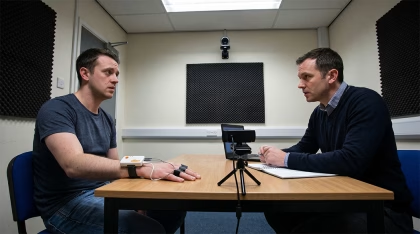
We set-up an internal sample remote behavioral research study, using our remote data collection platform and had employees at iMotions participate so that you could see behind the scenes of conducting remote research. Employees could choose when and where to participate from their own computers using their own web cameras and microphones.
Introduction
For this study, we created an imaginary pizza restaurant called Il Martello, “the hammer”, (our founder and CEO, Peter, refers to hammers a lot). We imagined that our imaginary pizza company wanted to test their menus and their video advertisements.
- Menus: they were interested in figuring out whether to go with a “build your own pizza” model or choosing from a predetermined list of pizzas.
- Video advertisements: they were interested in figuring out which ad was engaging and to whom it was engaging.
We created two menus and two video advertisements, so that the study could be set-up in an AB Testing format. The menus and video advertisements are shown below in the Stimuli Section.
This Remote Data Collection (RDC) study was designed to showcase the potential of combining surveys with remote behavior research tools such as:
- web camera based eye tracking
- facial expression analysis
- voice analysis
- web camera based respiration
Stimuli
Surveys
Participants completed three surveys. These were built in iMotions with the Advanced Study Builder that is part of iMotions Core.
Demographics
Questions about gender, where they grew up, whether people lived with other adults or children and how busy they were during a typical week.
Appetite
We asked participants to rate their current level of hunger and report the last time they ate.
Pizza Preferences
Survey included questions about toppings, how often people eat pizza, and whether they order takeout. We also asked about food allergies and intolerances.
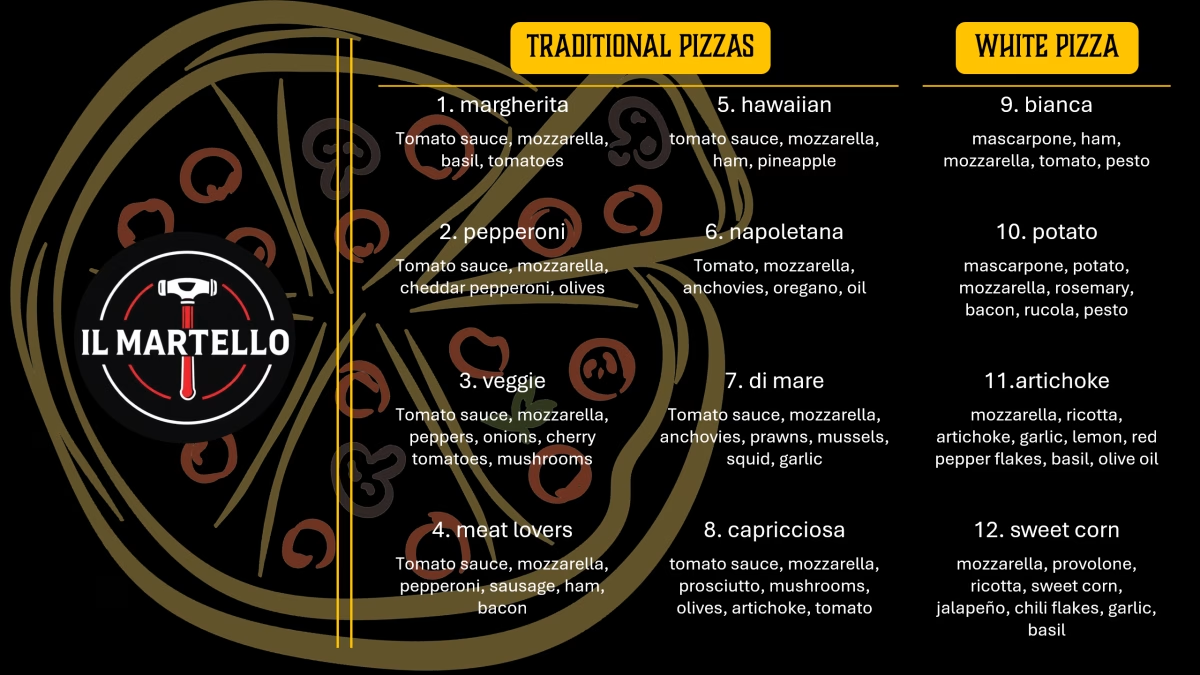
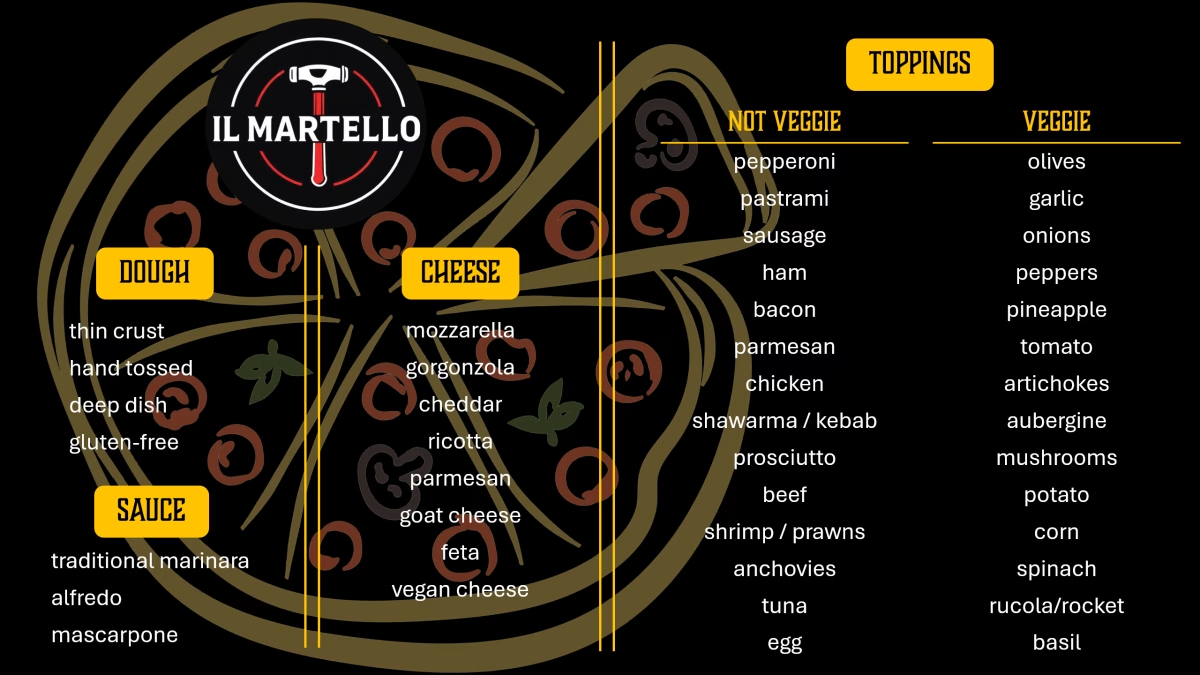
Menus
The menus served as an example of static stimuli. Both menus were presented to all study participants.
Video Advertisements
The video ads were an example of dynamic stimuli.
Ad 1: One ad included scenes of people eating pizza in groups with the narrator discussing the social aspect of pizza. It shows groups of people in different contexts sharing pizza and generally have positive facial expressions.
Ad 2: The other ad focused on convenience and displayed scenes in which food was being prepared and scenes showing people doing everyday errands (grocery shopping, looking through a fridge, walking up stairs, and cars in traffic) . These scenes only showed individuals and none of them seem particularly thrilled.

Teaching with iMotions Online?
You can use our sample study stimuli to run this study in your classroom!
Insight Examples
Here are three examples of insights you could get from a study like this one. There are also some suggestions for follow-up studies and analyses for your own inspiration.
Contents
- Biometrics add nuance to Survey Responses
- How to go beyond surveys for A/B testing
- Segment biometric data with Survey Responses
Biometrics add nuance to Survey Responses
Surveys help us understand participants and consumer’s intentions and preferences. They give us explicit information about the respondents’ thoughts and feelings. Comparing participant responses to their behavior gives more nuanced insights into their experience.
Example
In this study, one participant reported that they preferred the video ad that highlighted convenience and ingredients.
“More about the making pizza process, which I found more entertaining and tempting than the ‘lets all chill together’ vibe of the first one.”
In that particular video ad, the scenes showing the pizza making process (rolling dough, chopping onion, grating cheese, and spreading sauce) comprised only 35% of the total ad, but made an impression on this participant.
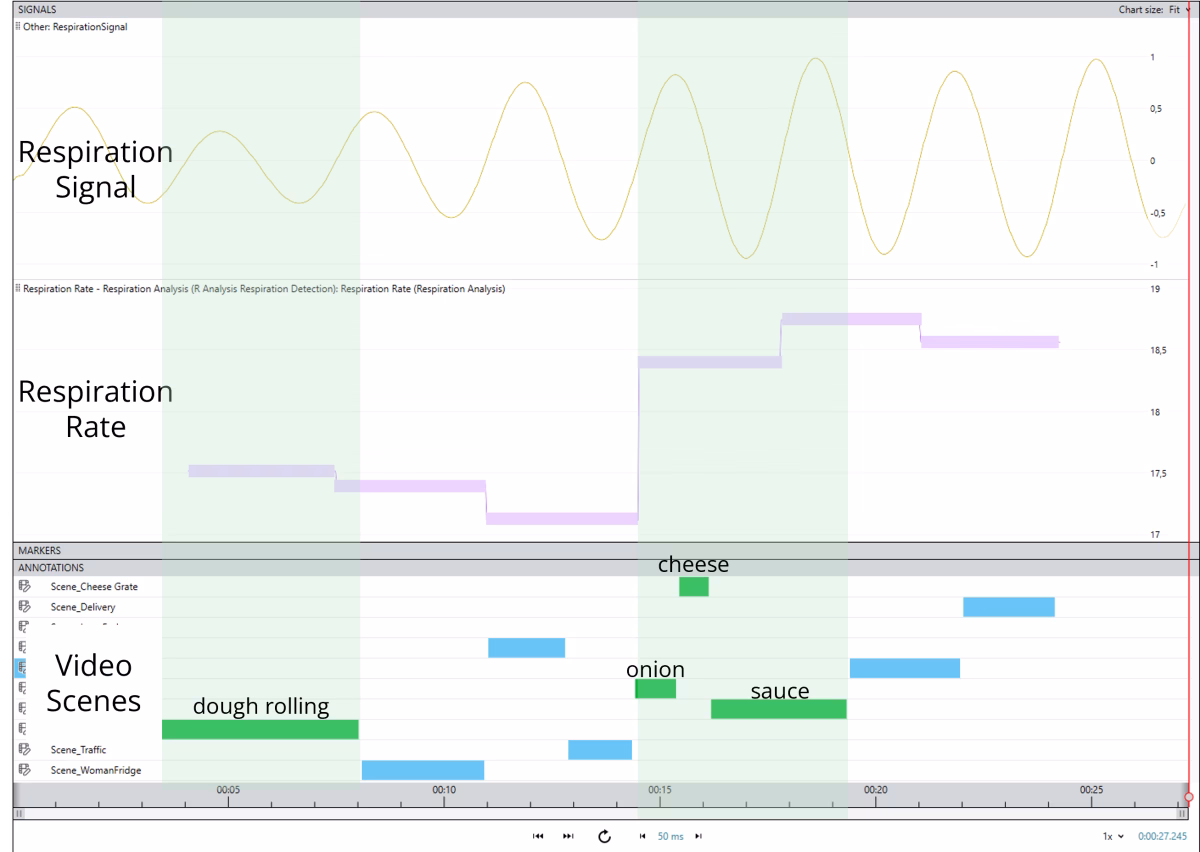
The top yellow wave shows the inhalation and exhalation of the participant. The middle purple line indicates the respiration rate (respiration cycles per minute). The higher the rate, the faster the breathing, the more aroused the person is. At the bottom, you can see the video scenes. The green bars indicate when there was food prep occurring in the ad. The light green rectangles across all three visualizations serve as a visual aid.
Looking at this participant’s respiration data, we can see that this participant had an increased respiration rate that coincides with food prep scenes, starting with chopping an onion and continuing through the rest of the ad.
This respiration data supports the respondent’s answer that they preferred scenes about making pizza. If this study was looking to brainstorm ideas for an effective ad, including more scenes related to making pizza might be an effective strategy for customers similar to this participant.
How to go beyond surveys for A/B testing
Amongst our participants, our survey results show that there was a clear favorite ad!
Because Il Martello designed this ad to focus on more social themes, they may assume that what people liked about the ad was the social aspect.

Why did people like this ad more?
These are examples of research questions that could be explored with remote data collection.
- Maybe these participants liked seeing people enjoying eating pizza together. We could look at eye tracking and facial expression analysis to see if participant’s faces show engagement when they are looking at faces in each ad.
- This ad showed nine pizzas and the other showed one (and a few pizza boxes at the end). We could look at eye tracking data in this ad to see whether viewers paid attention to the pizzas in this ad.
- This ad also had many scenes with people drinking beer. Perhaps participants were paying attention to the beer rather than the pizza. Again, we could use eye tracking to test this.
- Perhaps this ad had more scenes that affected participants’ arousal. We could also look at respiration data in both ads and see which scenes induced changes in arousal, similar to the individual shown above with the other ad. We could then compare to see which ad had more arousing scenes.
Why not just ask them?
Don’t worry, we did! In the survey, we gave them a free text field to tell us why they preferred their favorite ad.
We categorized the responses as reflections or evaluations based on the words they used in their survey response. Responses were considered reflections if they referred to themselves in their answer. They were considered evaluations if they did not include this kind of language. Below are some samples of actual responses.
Reflection
- “It shows made pizza, I like that”
- “I could relate to the first ad better. I could see myself more in those situations than being rushed in the second ad. Pizza is usually a planned meal for my family.”
- “I think they both work well.”
- “It relates more to me – I always buy pizza when I don’t feel like cooking, and not for any of the more “positive” motivators described in the first ad.”
Evaluations
- “Both of the ads have something missing and are very generic rather than connected to the restaurant (besides the logo at the end).”
- “Showed cooked pizza not just ingredients”
- “Happy smiling people eating pizza”
- “More relatable and the imagery chosen was also more relatable- like younger groups of people, POC…”
Many people that preferred the social ad did not provide reflections, but rather gave evaluations. They did not share which ad had a bigger effect on them personally, but rather reported which ad they thought would perform best generally.
This is where nonconscious metrics are very useful.
- Respiration rates could give us an idea of which ads or which scenes were the most arousing.
- Facial expression analysis data could be used to see which scenes were most engaging.
- We could have also used voice analysis rather than the survey question to gather information about their tone of voice when talking about each ad!
Segment Biometric Data with Survey Responses
By “segment the data”, we mean that we can divide our participants into groups and compare their biometric data. For example, we could compare data from people who grew up in one place to people who grew up in another. We could compare people that live with children to people who do not live with children.
A good strategy is to align the demographic questions with the ad targeting options you have. If you have the ability to target your ads by gender, ask respondents their gender so you can look at your data divided by gender. This way you could use your results to influence your strategy.
Below is a summary of some of the demographics survey data from this study. This shows some categories we could have used to segment the data.
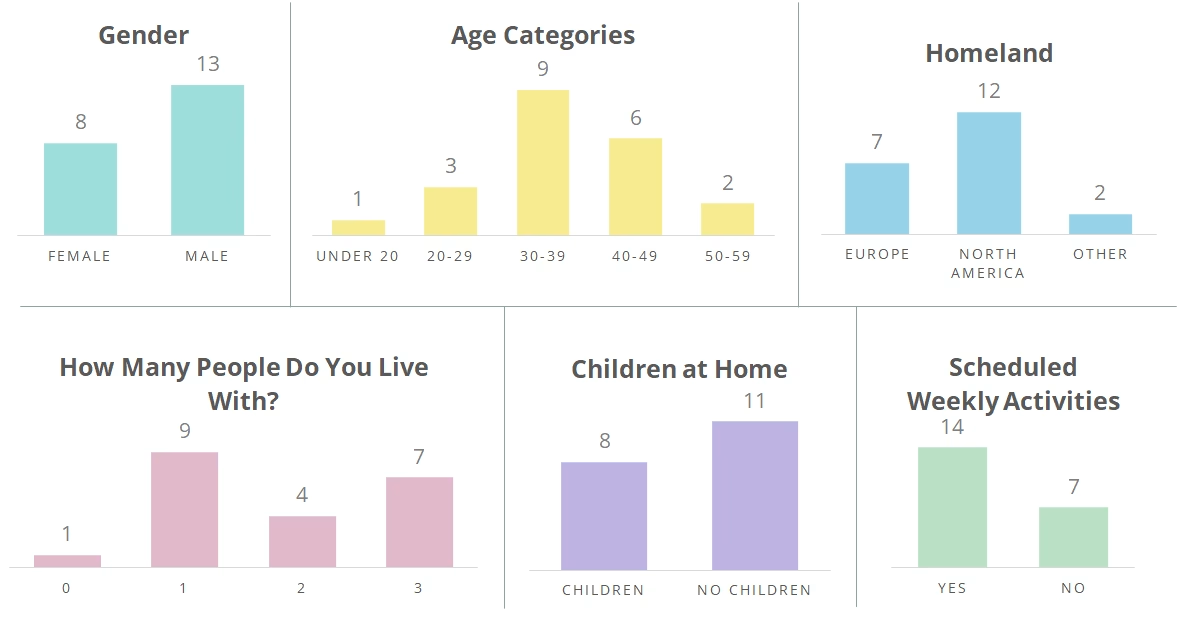
Example: Children vs No Children
Let’s say Il Martello was looking to target consumers with children. They want to know if participants with children pay more attention to children in scenes where there are children. They are considering developing an ad which will feature more scenes with children and families.
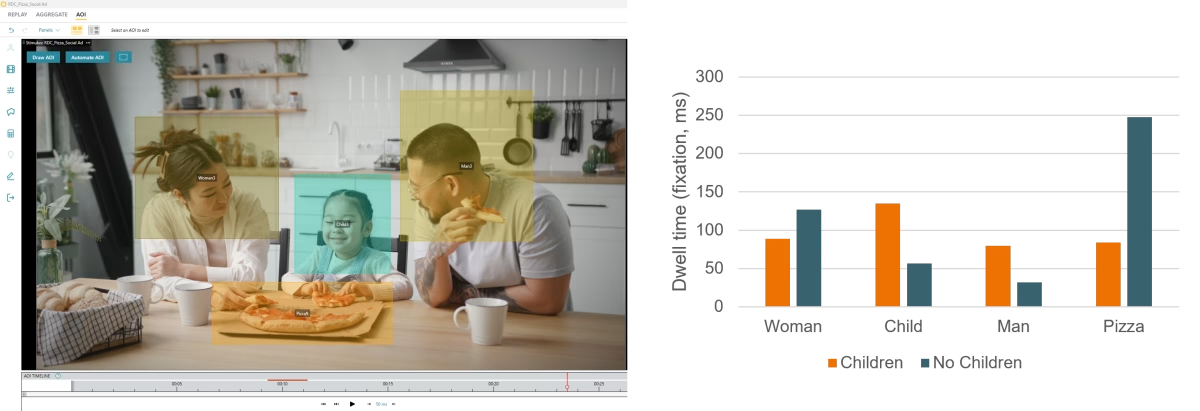
We took two different scenes from the social ad that have children, adults, and pizza in them. The graphs show comparisons of what participants who reported living with children look at (orange) compared to participants that do not live with children (blue). This is an example of segmenting the data by survey response. The data presented represents the average of the group.
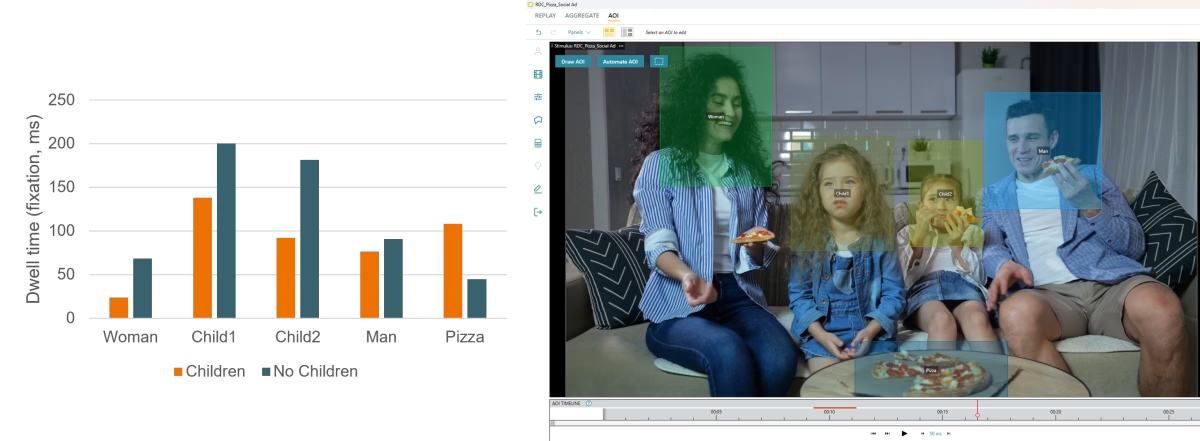
Problem: From this data, Il Martello has a mixed picture.
In the first scene, participants with children looked at Child1 more than Child2. Participants without children spent more time looking at the children compared to participants without children. Participants with children were more interested in looking at the pizza on the table compared to participants with no children.
In the second scene, participants with children looked more at the child than participants with no children. Participants with no children looked more at the pizza than participants without children, the inverse of what we saw in the previous scene.
Solution: Choose how far you want to go
Il Martello could decide that it is not worth making a separate ad to target potential customers with children since there is not clear evidence that these participants consistently respond differently to the scenes with children and families.
They could also choose to investigate further to see why the reactions to the scenes were different.
- The audio: The narrator mentions children explicitly in scene 1. “To make memories with our kids”. In scene two, the narrator says “Just Order Pizza”. One follow-up experiment would be to edit the video so that the scenes are switched but the audio is the same.
- The previous scene: For scene 1, the previous scene features ballerinas sitting on the floor eating pizza. For scene 2, the previous scene shows men drinking beer and eating pizza in front of a television. Switching the scenes could help us know more about how the previous scene contributes to the reaction to the chosen scenes.
- Viewing order: This data is from the first time the participants saw this advertisement. It would be relatively simple to look at only the second viewing or an average of the two viewings to see if the pattern is similar.
- A different comparison: To really get to the bottom of this question, they might also want to know how participants with children responded to scenes without children compared to scenes with children.
Conclusion
Surveys and biometrics together make for a more nuanced and powerful analysis. Biometrics add nuance to survey responses and help researchers dig a little deeper into their data. Surveys help researchers extract actionable insights from their biometric data.
To further your expertise in this field, staying updated on the latest breakthroughs is essential. Explore the **Top 5 Publications** from 2024 to gain cutting-edge insights and methodologies.
Behind the Scenes: Building A Study
Study builder makes designing a study easy without compromising on complexity. This study builder is featured in iMotions Core and is therefore a part of the Remote Data Collection platform as well as all iMotions Labs.
You can add stimuli in Flow Designer, which allows you to import and organize your stimuli.
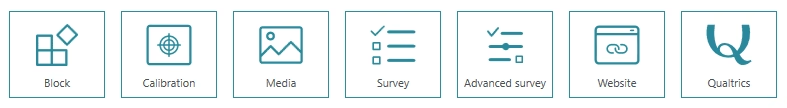
Adding Stimuli to this Sample Study
- Calibration: Because we were planning on using web camera-based eye tracking, we included a calibration step at the beginning and end of the study.
- Media: We used this option to import the menus and video ads. We also imported video countdowns as images of numbers.
- Survey: We used this tool for making participant instructions. We had already designed the instruction “slides” in Powerpoint, so we imported those slides as images in the Survey tool. This allows the images to have a visible “next” button so participants would know that they could advance the slide themselves.
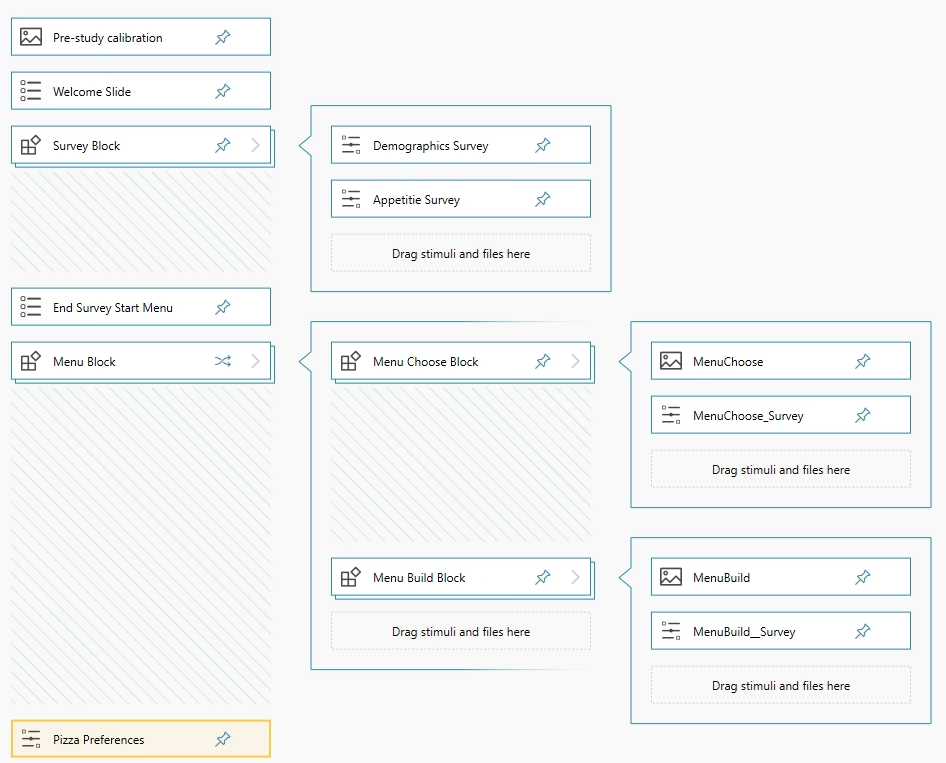
Block Design
In this study, we used block design to build the study.
Survey Block: This block was created simply for organizational purposes. It contains two surveys that were shown to all participants and always in the same order. When working with more complicated blocks, it is nice to be able to close other blocks so that more complicated study designs are still easy to follow.
Menu Block: Here we built blocks inside of blocks. Each menu would be followed by a corresponding survey asking what the participant would order, this was put into a block. There was one block for each menu type (Menu Choose Block and Menu Build Block). This ensures that the survey will always follow the right menu.
Then these blocks were put into the Menu Block. The Menu Block was set to randomize, meaning that it will randomly assign each participant to see either the Menu Choose Block or the Menu Build Block first. They will still see both.
If we wanted to do the study differently so that participants saw one menu OR the other (not both), we could build different flows in Study builder.
Video Ad Block: The next block was for the video advertisements. We included instructions and a countdown preceding each ad. Each participant saw each ad twice in a row, with a countdown between. Similar to the Menu Block, we randomized the order so that about half the participants saw Ad1 then Ad 2, while the other half saw Ad2 then Ad1. After they had seen both ads twice, they were asked which they preferred.
Advanced Surveys
The three surveys presented in this study were built in the Advanced Survey Builder. iMotions Core also allows for the integration of third-party survey tools, but for our purposes, everything we needed was already there.
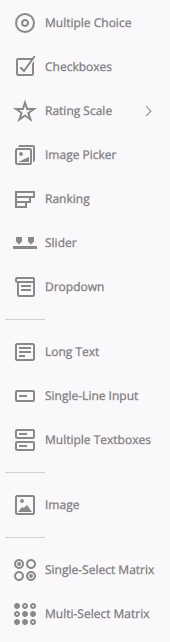
Advance survey gives you a lot of flexibility. We chose to present the and customize the look of the survey. For each question, you can decide the type of question (from the menu shown here). The question name will determine how the Question ID for your data, while the question title, is a more reader friendly question. You can decide whether questions are required or not (and even customize an error message if participants try to skip the question). You can customize the answer choices and the layout of the question.
You can also choose to import a JSON file. When we initially built the study, we ran a pilot. We had already built some of the surveys in the initial pilot. When we were creating the final study, we exported the JSON file from the pilot, imported it into the final study, and made any small changes we thought were necessary.
You can add logic to the survey. In our survey, we asked people how many other people they lived with. If they reported living alone, the built-in survey logic would skip further questions about the people the participant lived with. If a participant reported not living with children, they were not presented with further questions about children. In the final exported data, it did not give an error message but filled the cell with the text “EMPTY FIELD”. This makes analyzing the exported data from surveys much easier.
Stimuli Overview
Once we set-up the flow of stimuli, the Stimuli Overview allowed us to decide if a stimulus should advance automatically or manually, how long the stimulus should be presented for, and whether we wanted a web camera recording, screen recording, and/or mouse recording during each stimulus.
For example, with instructions is makes sense for the participant to choose when to advance based on how fast they read and understand the instructions. For the video countdown, we set each number image to be shown for one second, so that the count down was automatic.
To not overwhelm ourselves with data and reduce processing times, we decided to turn off some recording options. For example, we decided it was not important to have web camera/screen recording or mouse tracking during instructions. We also did not need to track the mouse while participants were watching the video.
After uploading the study to the iMotions Cloud, we sent out the participation link to iMotions employees. Those who wanted to participate did so on their own computers, whenever they wanted, wherever they wanted.