Discover Insights into Heart and Brain Connections. This article explores how heart rhythms reveal emotional and physiological states, the interplay between heart and brain activity, and the science behind ECG data. Uncover how these insights enhance research in healthcare, gaming, and emotional AI, while showcasing the power of combining ECG with tools like eye tracking and EEG.
Table of Contents
What Does The Heart Do, And How Does It Work?
Your heart, around the size of your fist, beating over 100,000 times a day, pumps the blood to every organ in your body. Oxygen-rich blood nourishes cells, allowing them to perform whatever operation they have developed to do. The waste product of the very same cells – carbon dioxide – is transported away simultaneously, ensuring that life can continue.
While the brain can be thought of as the control center of the body, the heart works like the power station, and as we will explain later on, these connections run even deeper than might be expected.
The Heart
While the fundamental function of the heart is to keep the body alive and working, there is much more to the heart than simply moving blood around. Nutrients, hormones, immune system cells are also managed by the heart’s rhythms (not to mention the internal temperature regulation). Furthermore, nuances in these rhythms can determine our ability to handle everything from running away from a dangerous situation, to completing a sudoku, to cracking the perfect joke. The heart really is at the heart of all we do. Let’s explore how it does it.
The Cardiovascular System – The Body’s Largest Network
What Does The heart do?
The heart isn’t just central to our body as a metaphor – it really is located in the centre of the chest, ideally positioned for transporting freshly-oxygenated blood from the lungs to the rest of the body, and carbon-dioxide-rich blood out and back to the lungs. This process, driven by the cardiac cycle, involves the meticulous co-ordination of these two organs, ultimately providing the body with energy. The cardiac cycle itself can be split into the following steps:
- An electrical impulse is generated by the heart (from the sinoatrial node at the top of the heart), causing the atria to contract.
- This contraction forces the blood from the right (containing deoxygenatedblood) and left (containing oxygen-rich blood) atria to pass into the left and right ventricles, respectively
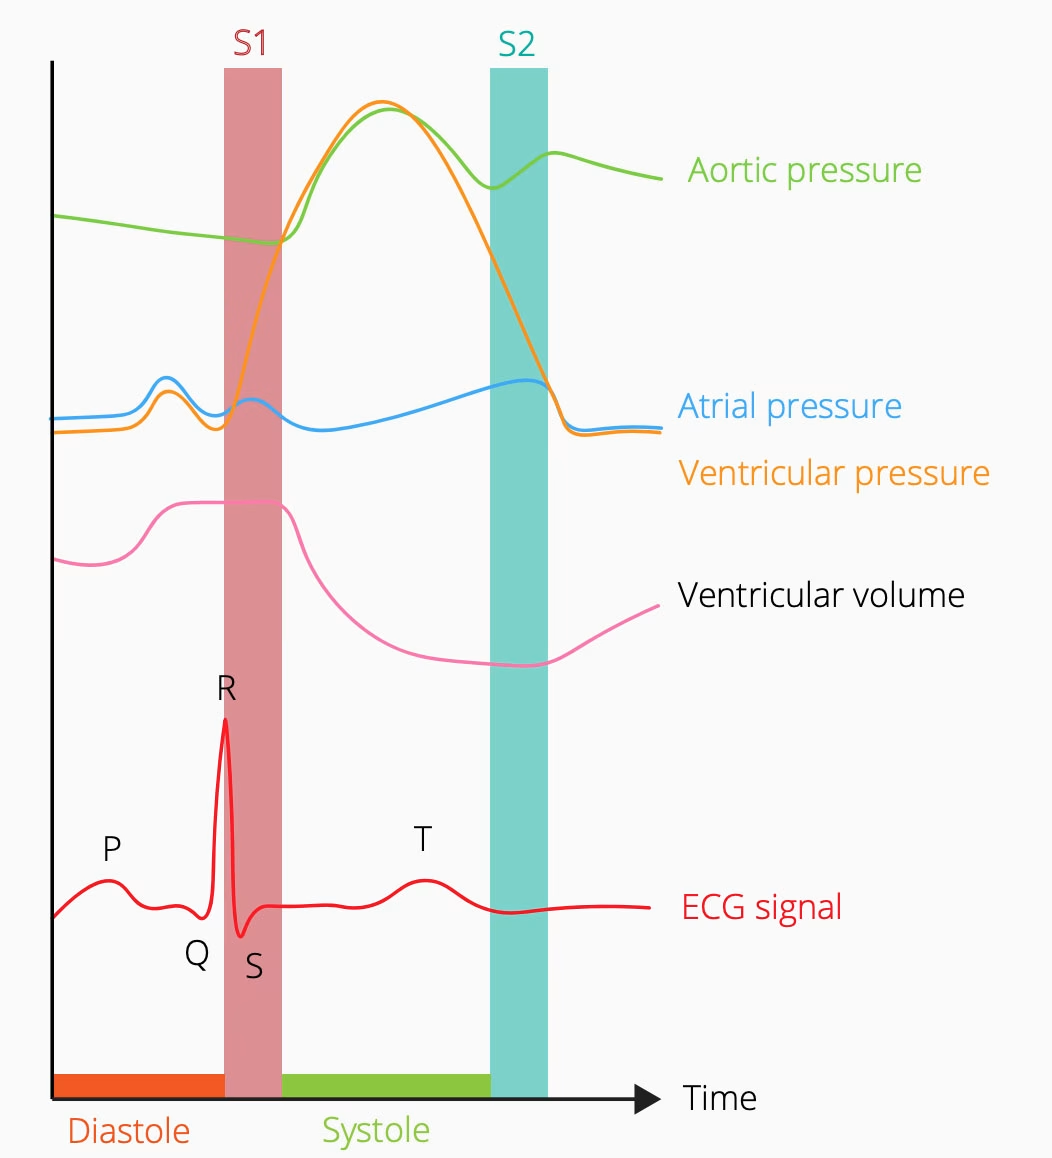
- The tricuspid valve (on the right) and the bicuspid valve (on the left) both closeas the blood passes through, ensuring that there is no backflow. This is the first “beat” sound of the heartbeat, and marks what is known as the beginning of “systole”
- The build-up of pressure in the ventricles forces the blood to flow from the area of high pressure, out into the body via the pulmonary valve and aortic valve respectively.
- As these valves close, the second “beat” sound of the heartbeat is produced, and “diastole” begins
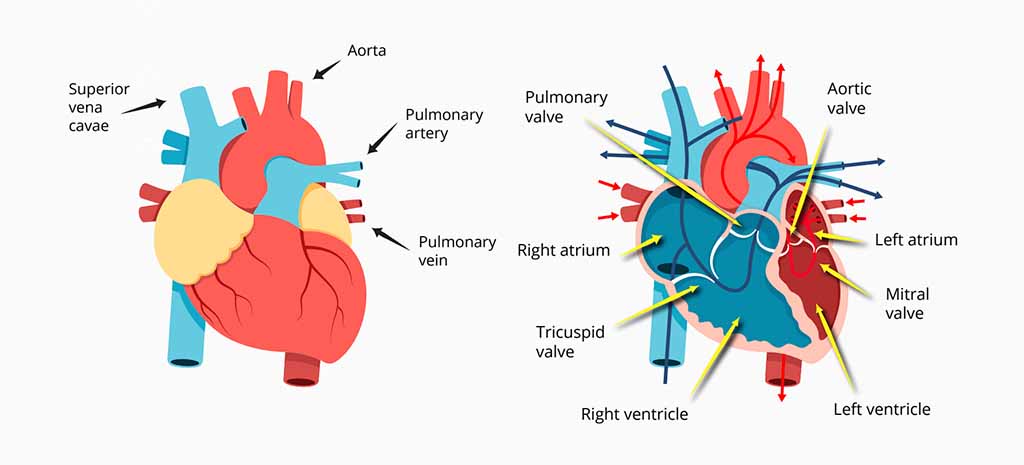
The process of the heart beating pushes the blood from the right, deoxygenated side to the lungs, where carbon dioxide leaves the blood cells and oxygen enters. This newly-oxygenated blood then travels back to the left side of the heart where it is pushed through the aorta.
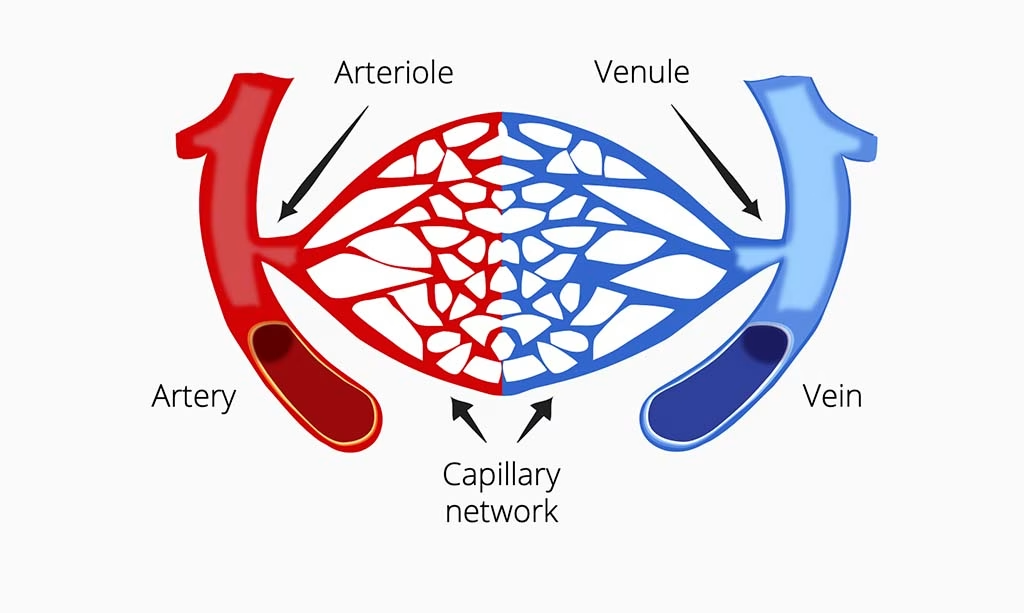
Back at the aorta, the blood then branches off into arteries, then smaller vessels called arterioles, and then finally into capilliaries. Capilliaries are deep in every part of our body, and the location where oxygen leaps over into cells (and carbon dioxide leaps back as a waste product). The blood can then continue its journey into venules, then veins, and finally back into the heart, before continuing its journey again (and again, and again…).
ECG signals
The QRS complex and beyond
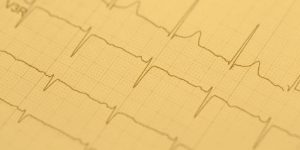
The electrical activity generated by the heart is detected and recorded by electrodes attached to the skin surface (we’ll talk more about the arrangement of these electrodes in the coming pages). The signal that is recorded – in a healthy heart – is known as the QRS complex. This is the typical zigzag pattern seen on a heart monitor that you may be familiar with. Below we will explain what lies behind the up and down of each part of the signal.
The P Wave
Just prior to the QRS complex there is a small increase in the electrical potential of the heart. The P wave represents atrial depolarization, in which the atria, at the top of the heart, begin to contract, forcing the blood into the ventricles. This part of the signal is in the diastole phase of the heartbeat, where the heart is relaxed and fills with blood. The time between the P and Q wave is (unsurprisingly) known as the P-Q Segment.
The QRS complex
The QRS is the largest and most informative component of the heartbeat, and is split into three parts:
Q – The Q wave is the initial dip in the ECG signal before it spikes. This represents the depolarization (decrease in relative electrical potential) of the heart. This specifically occurs in the interventricular septum, which is the wall seperating the ventricles. This is when the ventricles fill with blood from the atria.
R – The R wave represents the repolarization of the ventricles, where the reduced electrical signal increases from its previously lowered position (shown by the Q wave) to a peak. As the ventricles are the largest part of the heart, this change in the signal is particularly large. This is also where the valves seperating the ventricles and atria close – producing the first of the two thuds of the heartbeat.
S – The S wave is in a sense a continuation of the R wave, in which the signal is depolarized once more. The previously high signal falls from its peak and falls below the baseline. The blood is pumped out of the high-pressure ventricles, and newly- arriving blood begins to enter the atria.
The T Wave
The T wave is essentially the time in which the heart’s electrical activity resets to baseline, in anticipation of the signal once again being triggered, and the PQRS steps commencing once again. At the tail-end of the T wave, the ventricular valves (the pulmonary and aortic valve) close, creating the second thud sound of the heartbeat. The relative trajectory of the signals, steps, and changes in pressure are all shown in the graph below.
In the clinic
ECG was originally – and of course still is – used in the clinic, before it was adopted for behavioral insights. Healthcare practitioners are trained to be able to decipher the ongoing ECG signals that are generated by the heart, to determine if the heart is acting normally, and what is happening if things go wrong. As the ECG signal relays information about the mechanics of pressure and volume in each part of the heart, it’s possible to diagnose which components might need help in order to function normally again.
Conditions such as hyperkalemia (the presence of too much potassium in the blood) can, for example, be spotted due to the peaked T wave following the R peak of the QRS complex. This results from the potassium depolarizing the myocardia (the muscle tissue of the heart) too much. This increased depolarization increases the level of activity required in order to contract the heart – if this threshold becomes too high, the heart cannot properly beat and cardiac arrest begins. Such information allows physicians or nurses to provide appropriate care by treating the underlying affliction – all from seeing an abnormal ECG signal.

The Heart And The Mind
When people are asked to identify the cause of an increase in physiological arousal, they often misattribute the source. We might think we understand everything that’s going on with our body, but studies show that this is often not the case.
An influential study by Schacter and Singer in 1962 showed how this occurs. Participants were told that their vision would be tested after they were given vitamins. They were instead either given epinephrine (also known as adrenaline), or a placebo drug.
They were then told that the the effects of the drug were the same as epinephrine, or that they might feel some discomfort, or they were told nothing at all. Epinephrine is known to activate the central nervous system, bringing about such changes as increased heart rate and pupil dilation. The participants were then placed in a waiting room with a confederate (an actor employed by the researchers) of the study who either pretended to be angry, or happy.
The angry or happy conditions were a series of standardized steps (step fifteen of the happy condition: “Stooge replaces the hula hoop and sits down with his feet on the table. Shortly thereafter the experimenter returns to the room.”) that were intended to influence the emotional state of the participant.
The participant then had to complete a questionnaire about how they were feeling.
They found that not only was the emotional state of the participant influenced by the apparent emotion of the confederate (and more so in the epinephrine condition), but that the participants also attributed that emotion to events entirely unrelated to the situation they were currently in.
This suggested that participants (and people more generally) are less aware of the malleability of their emotional states, misattributing how they are influenced. Why do we bring that up? Let’s explain: physiological arousal is related to emotional arousal, yet the reasons for our emotional state can be difficult to know.
With this in mind, monitoring arousal using biosensors presents an objective alternative to the otherwise subjective inferences that participants inevitably make. Heart activity is closely linked to physiological and psychological arousal, making it ideal for understanding our mental states in greater detail. In the next few pages, we’ll give you the details of how this happens.
The Heart And The Brain
The heart and the brain have an intimate relationship – the activity of each can determine how the other operates, and both rely on each other to function properly. While the activity of the heart is primarily self-perpetuating (meaning that it can trigger its own movements), there are two main ways in which the brain influences the rhythm and pattern of heart rate – through sympathetic and parasympathetic activity.
You might know these systems for their involvement in the “fight or flight” response (sympathetic activity), or “rest and digest” (parasympathetic activity). Another way to think about these systems is that sympathetic activity is physiologically arousing, while parasympathetic activity is physiologically calming.
The sympathetic / parasympathetic influence upon the heart is specifically triggered by the action of the parasympathetic vagus nerve or the sympathetic trunk nerves. The sympathetic trunk nerve can also influence the strength of the cardiac contraction – how hard the heart squeezes blood out. These nerves connect to the medulla oblongata of the brainstem, which sits at the very bottom of the brain, close to the spinal cord.
If you follow these connections further, the medulla oblongata is influenced by activity in so-called “higher” brain structures – areas of the brain that are (or are connected to other areas of the brain that are) involved in essentially every part of living – seeing, doing, thinking, and everything else. This activity can effect the medulla oblongata, which can send a signal further down to the heart, changing its activity.
Let’s dig deeper and look at two specific ways in which brain activity modulates heart activity.
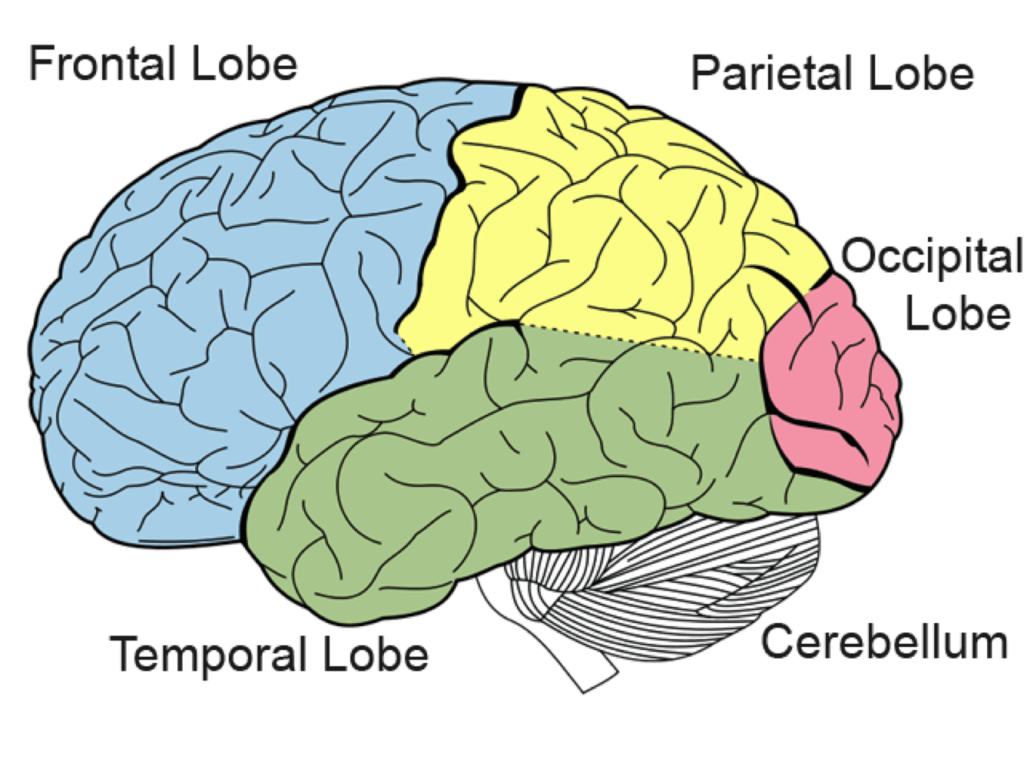
Both the sympathetic and parasympathetic influences on the heart can be traced back to the prefrontal cortex (within the frontal lobe). This is the area of the brain that sits at the front of your head, and is often seen as the command center of the brain where it’s involved in planning, decision-making, and moderating our behaviors. If we’re thinking something through then our prefrontal cortex is busy doing the calculations.
It’s also in charge of the amygdala – this part of the brain is heavily involved in our fear response (there are two amygdalae – located symmetrically within the brain, in the temporal lobes). If something scares us, triggering a sympathetic response, then the prefrontal cortex allows the amygdala to fire up.
This activity then allows the medulla oblongata to send a signal to the heart that it needs to be more active – danger is on the way. If there isn’t anything scary around, then the parasympathetic activity takes over, the amygdala stays quiet, and the heart defaults to a normal speed.
The amygdala can also allow an area of the brain called the solitary tract (surely the loneliest part of the brain) to influence another part of the medulla oblongata. This area (specifically, the nucleus ambiguus and the dorsal vagal motor nucleus) usually prevents the heart rate from speeding up (the parasympathetic response).
However, if this area receives a signal from the amygdala or elsewhere (a sympathetic response), it stops telling the heart to slow down, and the heart responds by increasing its activity.
If the heart is more active, it allows more oxygen to enter into the body – including the brain. This can then have a calming effect (if there isn’t a reason to keep the heart rate pumping fast of course!), increasing the parasympathetic response, allowing the brain to signal to the heart to slow down once more. All of this creates an intricate feedback loop, with both the brain and heart working in tandem.
But how does this play out in everyday life? Our hearts don’t usually pound in fear while watching a TV ad, playing a video game, or a (non-scary!) movie. The reality is that our brain and our body are constantly evaluating the world around us. Minor adjustments and reappraisals are made all the time, triggering tiny changes that shape – and are shaped by – our experiences.
Even though these differences can be quite small, they can be detected by ECG. This can give us insight into how the brain is responding to the stimuli around it – whether that’s heart-thumping public speaking, or becoming engrossed in a mobile game. The heart tells a story about what happens beneath the surface.
Collecting ECG Data
Application Areas – Where is ECG Used?
ECG data can be used to provide information about participant’s physiological and emotional arousal in many fields and settings. The hands-free application, combined with the high fidelity data and wide ranging analysis methods means that ECG is well suited for understanding behavior across both academic and industry research.
| Healthcare | Simulations and training |
| ECG is widely used in medical settings, but also has applications for psychological treatments, such as with VR therapy. Sports science also commonly uses HRV analysis of ECG (more on that later). | Flight simulator (or other simulator) training can benefit from understanding the stress and fear response of participants, who also need to use both their hands – ECG is ideally suited for this. |
| Emotion AI | Gaming |
| Creating emotional AI systems requires understanding human emotions in the real world. ECG is a widely used solution for R&D within this field. | ECG is ideal as a non-intrusive, hands- free measure of emotional arousal during gameplay. Both short and long-term metrics can be informative for analysing the gameplay experience, whether in VR or on-screen. |
Collecting Clean ECG Data
There’s No Substitute For Clean Data
Clean data is the cornerstone of good research. While there are methods that can be helpful in cleaning up partially noisy data, the most common approach is to simply discard it. It’s therefore important to ensure that you collect data that most closely reflects the physiological process of interest.
The basic principle of “GIGO” (garbage in, garbage out) also applies to ECG data. Therefore, always start with properly recorded data. Recording clean data has a couple of perks beyond just making analysis easier:
Scientific reliability and validity: The more clean data you have, the more power your results have. Creating a credible analysis requires as many valid datapoints as possible (or at least as many as are practical).
Publish more and better papers: Clean data implies that your hypotheses can be tested much better. If you only have bad data, how can you be sure that an effect is due to differences in physiological or cognitive states, and not just a side- effect of some artifact? Reviewers look favorably upon artefact-free data.
Run more experiments per year: Don’t waste your time trying to make the best out of badly recorded data. Collecting clean data allows experimental execution to be streamlined, and saves money as data collection doesn’t need to be repeated.
Electrode placement
ECG systems use electrodes attached to the skin to pick up electric potentials generated by the heart. Specifically, ECG records the electrical activity generated by heart muscle depolarizations, which propagate in pulsating electrical waves towards the skin. Although the electricity amount is in fact very small, it can be picked up reliably with ECG electrodes (in microvolts, or uV).
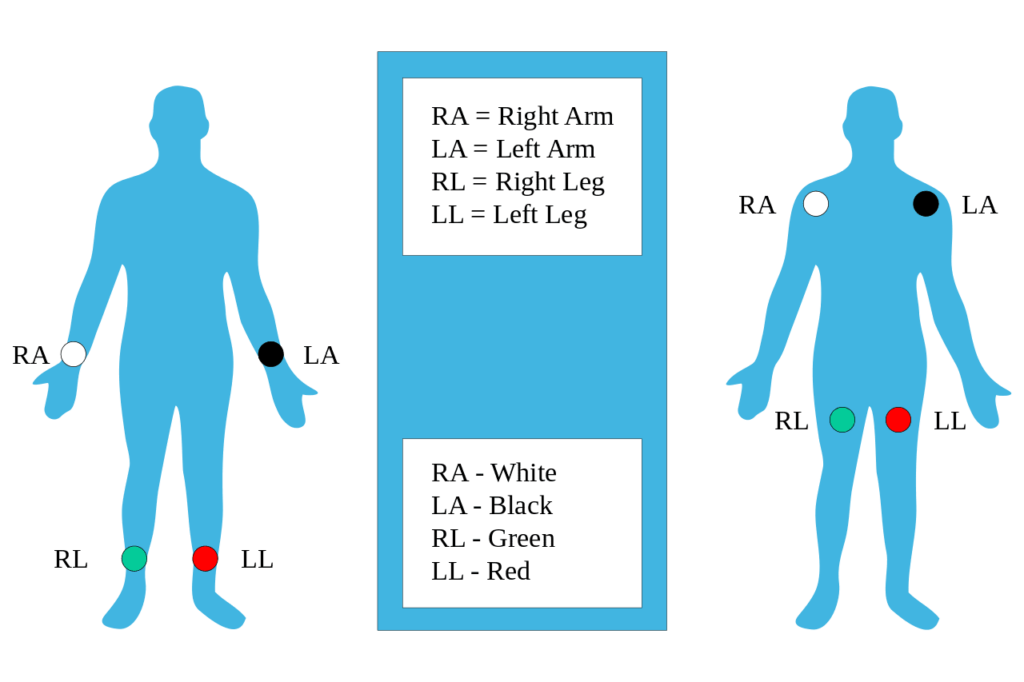
The full ECG setup comprises at least four electrodes (more are also commonly used) which are placed on the chest or at the four extremities according to standard nomenclature (RA = right arm; LA = left arm; RL = right leg; LL = left leg). Of course, variations of this setup exist in order to allow more flexible and less intrusive recordings, for example, by attaching the electrodes to the forearms and legs. ECG electrodes are typically wet sensors, requiring the use of a conductive gel to increase conductivity between skin and electrodes.
How To Get Optimal ECG Data
Consider electrode impedance
A stable electrical connection between electrode and skin is key to recording clean ECG signals. However, skin isn’t a perfect conductor of electricity, and electrical resistance can build up. The technical expression in case of ECG recordings is impedance, which is measured in units of Ohm (Ω). Only when impedances are low you can be absolutely sure that the recorded signal reflects the heart activity rather than artefactual processes from the surroundings. Therefore, whenever you collect ECG data, make sure that impedances are as low as possible.
Apply electrode gel/conductive paste
Some conductive pastes are abrasive and contain pumice stone particles (similar to a facial mask). In this case, you can lower impedances massively by dipping a Q-Tip or a wooden stick with a cotton swab into the paste and then applying the paste to each of the electrodes. Gently push down and rub the stick. Non-abrasive gels (similar to gels used for ultrasound recordings) don’t rely on your rubbing skills. Instead, you can simply paste the gel onto the electrode.
Clean all electrode sites with alcohol
You can use a 70% isopropanol, alcohol swabs, or Q-tips dipped in alcohol, for example. Before plugging in the electrodes, you can press an alcohol-dipped Q-tip into each of the electrodes and rub it gently, but with purpose. Always wait until the alcohol is completely evaporated before you proceed.
Reduce movement of electrodes
This can cause severe artifacts that are visible in the affected channel or in all channels. There can be many reasons for this, but one of the most likely is that the electrode may have become loose. It’s always recommended to make sure that the electrodes are securely attached to the skin.
Watch out for line noise
This is commonly 60 Hz in the US, and 50 Hz in the EU. This can have strong artifacts on the electrode recording – this becomes quite obvious in the raw ECG data. Particularly when impedances are poor, line noise is stronger.
ECG Analysis – What can the heart tell you?
Recording heart rate data gives you access to the following parameters that can be interpreted with respect to a participant’s arousal:
Heart Rate (HR). HR reflects the frequency of a complete heartbeat from its generation to the beginning of the next beat within a specific time window. It is typically expressed as bpm. HR can be extracted using ECG and PPG (photoplethysmography) sensors.
Inter-Beat Interval (IBI). The IBI is the time interval between individual beats of the heart, generally measured in units of milliseconds (ms). Typically, the RR-interval is used for the analysis.
Heart Rate Variability (HRV). HRV expresses the natural variation of IBI values from beat to beat. HRV is closely related to emotional arousal: HRV has been found to decrease under conditions of acute time pressure and emotional stress (meaning that the heartbeat is more consistent).
HRV Analysis – Understanding Heart Rate Variability
One of the first things to know when understanding heart rate is that one of the most informative metrics relies not just on the heart rate, but how much the heart rate varies. What’s often at first glance counter-intuitive about this metric is that a higher heart rate variability (HRV) is associated with good health – the more your heart jumps around (to an extent, of course), the readier you are for action. On the other hand, a low HRV is associated with ill health – it is a significant predictor of mortality from several diseases.
While the medical uses of HRV are widely used, there are also aspects of thoughts, emotions, and behaviors that can be derived from HRV data.
From psychology studies, we know that HRV is associated with many factors. Researchers have found that an increase in HRV is related to increased self-control abilities, greater social skills, and better abilities to cope with stress, among other findings. The applications are therefore clearly more broad than directly medical situations.
Overall HRV can be said to be an indicator of physiological stress or arousal, with increased arousal associated with a low HRV, and a decreased arousal associated with high HRV. Using ECG alongside other measurements therefore provides another way to investigate how people respond to different settings or stimuli.
How HRV is calculated though is where things can get tricky. Methods work in different ways, and the results from each might not be directly comparable – getting it right is therefore critical for your work or research.
Before we get there though, there are some things to know about the way the monitored ECG signal appears. The image below shows a prototypical heartbeat (introduced in more detail on pages 7-8. This is known as the QRS complex, with each letter corresponding to a different part of the heart’s action.
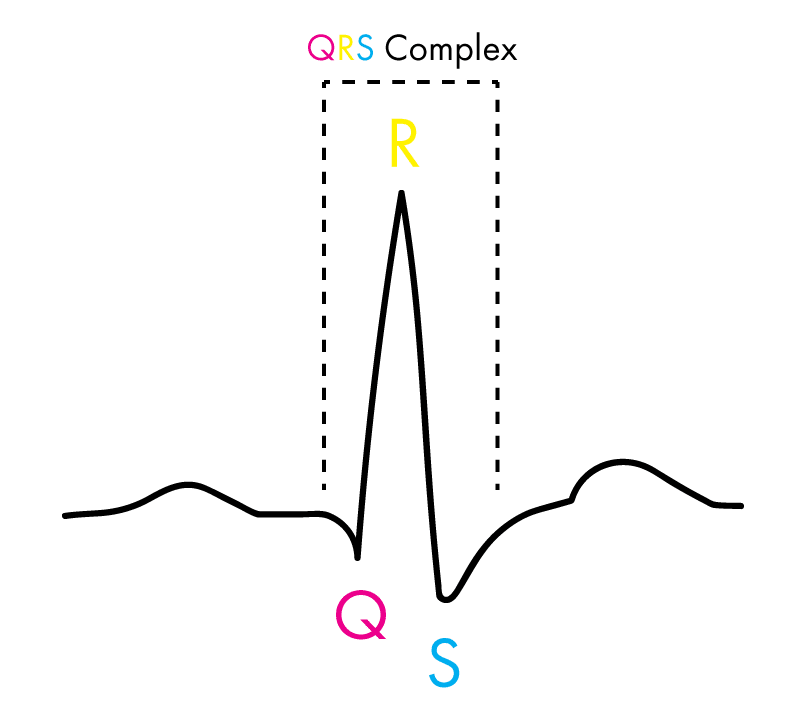
The important thing to note is that the “R” of the complex is the area from which the values for analysis are taken. When we have several heartbeats next to each other, then the distance (in milliseconds) between each “R” is defined as the “RR interval” (or sometimes the “NN interval” to emphasize that the heartbeats are normal).

One of the main divisions for the way in which HRV is calculated is by either using time or frequency. In this context, time-domain methods mean that the beat-to-beat amount within an amount of time is used, while frequency-domain methods count the amount of low and high frequency beats that occur. This is explained further in the image below.
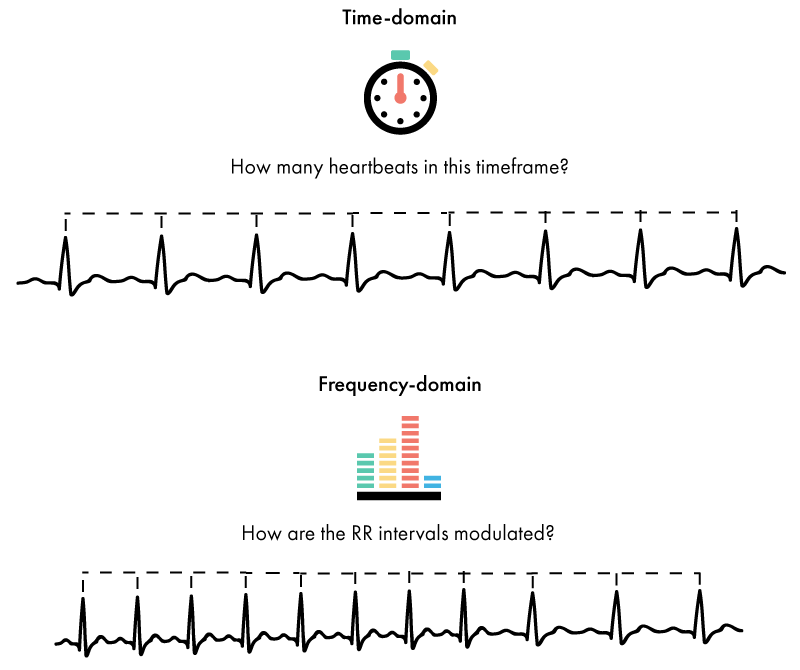
The extent to which the heart rate changes within a set amount of time, or the extent to which it is spread over different frequencies, will determine the amount of HRV.
There are also other ways in which to analyse the heart rate data, including geometric and non-linear methods. These methods offer new ways of examining the data, yet are not currently as widely employed.
ECG – Time Domain Methods
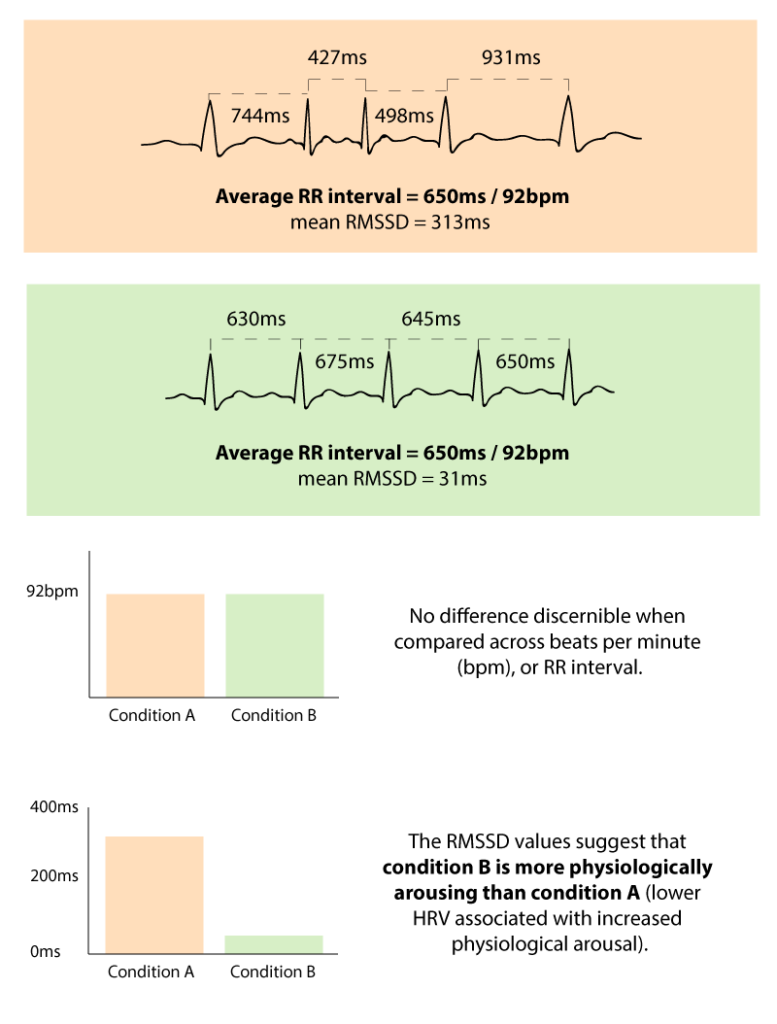
The single most common way in which to analyse HRV is a time-domain method called RMSSD. This is the Root Mean Square of Successive Differences between each heartbeat. It is relatively simple to calculate (important for large-scale computation), and provides a reliable measure of HRV and parasympathetic activity. How to calculate it is shown in the image below.
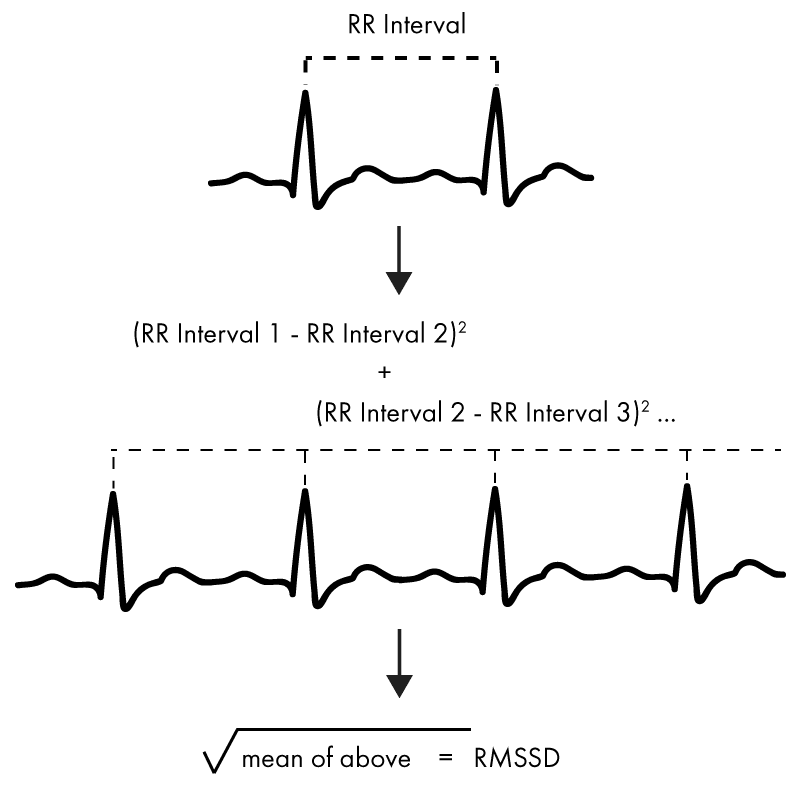
Two of the other most common time-domain methods used to calculate HRV are called SDNN, and SDANN. SDNN is calculated as the standard deviation of all of the RR intervals (the distance between each heartbeat, or the “R” of the QRS complex). The SDANN is similar, but requires that you first take the average RR interval from several 5 minute sections of a recording, and then the standard deviation.
Frequency-Domain Methods
Of the frequency-domain methods, data related to the amount of low frequency (LF) heartbeats is often used (0.04 to 0.15 Hz) as a measure of sympathetic nervous-system activity. Measurements of high-frequency (HF; 0.15 Hz to 0.4 Hz) and very low-frequency (VLF) are also used. The frequency is not concerned with heart rate per se, but the modulation of HRV.
In addition a ratio of HF and LF (HF/LF) can be determined to give information regarding the amount of sympathetic nervous system activity, but the strength of this has been debated. It is important to note that the Hz values don’t strictly refer to the number of heartbeats, but to the rate of recurrence of heartbeat rates.
Poincaré plots
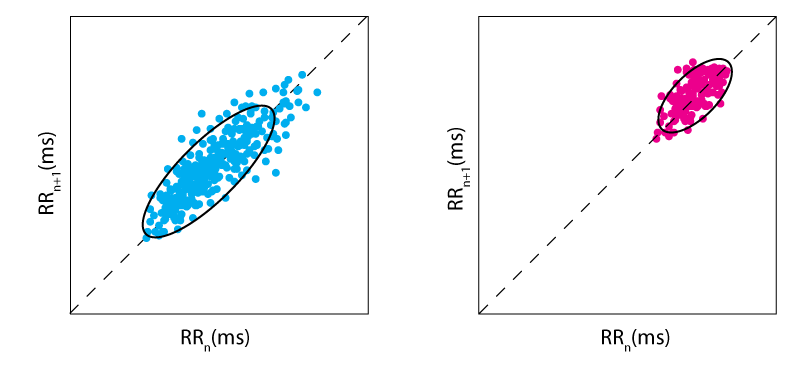
One of the most common visualization methods of HRV is a graph called a Poincaré plot. Named after the illustrious French mathematician, the graph plots the RR intervals (the distance between each heartbeat), with the RR interval just prior (shown below).
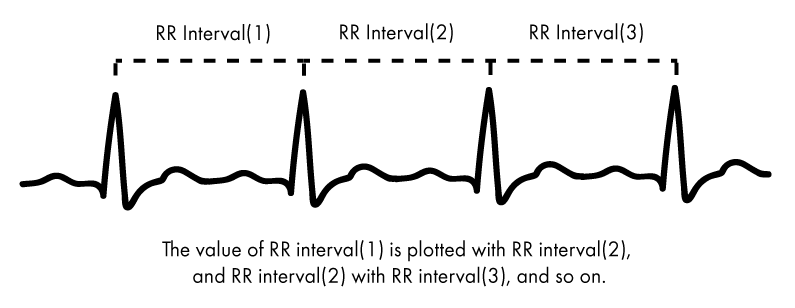
The Poincaré plot therefore shows how well each RR interval predicts the next – a greater spread of values would mean an increased HRV, while the closer they bunch together, the less HRV there is.
Two examples of Poincaré plots are shown below – the left shows a high heart rate variability, while the right shows a limited heart rate variability. By using Poincaré plots and other sophisticated analytical techniques, it’s possible to further numerically quantify the HRV of respondents.
Comparing HRV (Heart-rate variability) values
While the time-based and frequency-based methods are varied in both their calculation and execution, the story they tell is essentially the same – a quantification of HRV. The results from each method and test can inform findings that relate to not only our well-being, but also our psychological state too.
Although there are no standard accepted values that can be used to compare HRV results, it is possible to look at how the results of respondents compare to each other. This measurement also provides a more suitable comparison than using beats per minute (bpm). An example of how this could look is shown in the image below.
Kick Off Your Research
ECG and multimodal research
ECG is a non-expensive, non-invasive and completely passive recording technique. ECG data also has excellent millisecond time resolution, making it an ideal research tool for studying the precise timing of emotional and physiological processing. Both standard and advanced analytical methods provide deep and credible insight into human behavior processes.
Of course, data based on heart rate alone offers valuable insights into nonconscious arousal in response to emotionally loaded stimulus material. However, data solely based on ECG data can‘t tell us whether the arousal was due to positive or negative stimulus content.
Why? The change in heart rate is in fact identical. Both positive and negative stimuli can result in an increase in arousal triggering changes in heart rate.
In other words: While ECG is ideal measures to track emotional arousal, it’s not able to reveal emotional valence, the direction of an emotion. The true power of ECG unfolds when this sensor is combined with other data sources such as facial expression analysis, EEG, and eye tracking. So while ECG alone already provides a rich amount of insight into human behavior, you might want to consider adding other sensors in order to get the full picture.
ECG and Eye Tracking
TV ads, video games, movies, websites, devices as well as social interaction partners in private life and in the workplace – we could process none of these without our vision. If you present visual stimuli on screen, you should always collect eye tracking data to be absolutely sure where participants are directing their gaze to and how this is affecting cognitive processing. Combined ECG and eye tracking recordings allow you to monitor both participants’ attention as well as arousal levels during stimulus presentation with emotional or cognitively challenging stimuli.
ECG and Facial Expression Analysis
ECG alone cannot assess if participants are expressing a positive or negative emotion in observable behavior. This is why you should always consider adding facial expression analysis to the list of beneficial sensors for your next ECG study. Facial expression analysis is a non-intrusive method to assess head position and orientation, action unit movements (such as lifting of the eyebrows or opening of the mouth) and for measuring global facial expressions of basic emotions (joy, anger, surprise etc.), all from using a webcam placed in front of the participant. Facial data is extremely helpful to further understanding of physiological arousal.
ECG and EEG
Electroencephalography (EEG) records electrical activity using electrodes placed on the surface of the scalp and outputs this electrical activity as a series of underlying brain waves. Measuring electrical activity from the brain is useful because it reflects how the many neurons in the brain communicate with each other via electrical impulses, and how they are associated with cognitive processes such as drowsiness/alertness, wakeful relaxation, and approach or avoidance.
The most central element of EEG is its excellent time resolution. It can take hundreds to thousands of snapshots of electrical activity within a single second. This renders EEG an ideal technology to study the precise time course of cognitive and emotional processing underlying behavior. Combining EEG and ECG allows for an understanding of not just how a person responds to a stimulus, but also how strongly.
ECG and EDA/GSR
Electrodermal activity (EDA; or galvanic skin response (GSR)) reflects the amount of sweat secretion from sweat glands in our skin. Increased sweating results in higher skin conductivity. When exposed to emotional content, we sweat emotionally. Skin conductance is controlled nonconsciously, that is, automatically. EDA can serve as both a check of ECG (as both are capable of measuring physiological arousal), as well as a powerful addition to ECG data.
ECG and EMG
Electromyographic sensors monitor the electric energy generated by body movements. EMG sensors can be used to monitor muscular responses of the face, hands or fingers in response to any type of stimulus material. Even subtle activation patterns associated with nonconsciously controlled hand/ finger movements (startle reflex) can be assessed with EMG.
The iMotions Platform
Before you begin your next ECG study, you certainly want to think about which recording and data analysis software to use. Usually, separate software is required for stimulus presentation and ECG recording (and that’s before any other biosensors are added to provide more information). What if there was a multimodal software solution that allows for presenting any type of stimuli while recording data from ECG, eye tracking, facial expression analysis and other biosensors (such as EEG, EDA, EMG) without having to piece everything together?
The iMotions Platform is one easy-to-use software solution for study design, multisensor calibration, data collection, and analysis.
Out of the box, iMotions supports over 50 leading biosensors including facial expression analysis, EDA, eye tracking, EEG, and EMG along with survey technologies for multimodal human behavior research. Get in touch with our team at iMotions to learn how we can help elevate your research!
References
Barbas, H., Saha, S., Rempel-Clower, N., Ghashghaei, T. (2003). Serial pathways from primate prefrontal cortex to autonomic areas may influence emotional expression. BMC Neurosci., 4.
Blackburn H, Keys A, Simonson E, Rautaharju P, Punsar S. The electrocardiogram in population studies. A classification system. Circulation 1960;21: 1160-75.
Brosschot, Van Dijk, & Thayer (2007). Daily worry is related to low heart rate variability during waking and the subsequent nocturnal sleep period. International Journal of Psychophysiology, 63 (1): 39–47.
Dutton & Aron (1974). Some evidence for heightened sexual attraction under conditions of high anxiety. Journal of Personality and Social Psychology, 30: 510–517.
Hagit et al. (1998). Analysis of heart rate variability in posttraumatic stress disorder patients in response to a trauma-related reminder. Biological Psychiatry, 44.
Jönsson (2007). Respiratory sinus arrhythmia as a function of state anxiety in healthy individuals. International Journal of Psychophysiology, 63 (1): 48–54.
Kannel WB, Gordon T, Offutt D. Left ventricular hypertrophy by electrocardiogram: prevalence, incidence, and mortality in the Framingham study. Ann Intern Med.1969; 71:89–105.
Nickel & Nachreiner (2003). Sensitivity and Diagnostics of the 0.1-Hz Component of Heart Rate Variability as an Indicator of Mental Workload. Human Factors, 45 (4): 575–590.
O’Keefe JH, Hammill SC, Freed MS, Pogwizd SM. The complete guide to ECGs. Jones & Bartlett Publishers; 2008.
Schacter, S., & Singer, J. (1962). Cognitive, social and physiological determinants of emotional state. Minneapolis: Psychological Review.
Thayer, J.F., Lane. R.D. (2009). Claude Bernard and the heart-brain connection: Further elaboration of a model of neurovisceral integration. Neuroscience and Biobehavioral Reviews, 33, pp. 81-88.
Free 32-page ECG Guide
For Beginners and Intermediates
