From big studios putting out AAA titles, to one-man indie operations, game developers have begun to embrace biometric data to design better interfaces, more impactful experiences, and improved gameplay.
If you are a game developer or tester who is now confined to your home battle station, you can still do effective biosensor-based game testing. One thing I’ve been doing with my additional free time is getting back into my CS glory days. Now, I haven’t touched CS since the de-dusk days back in the 2000s, but I wanted to check out the new Esports version and see how it holds up under a neuroscientific lens.
This article will focus on a few tools I’m currently using from home and how you can apply them to your remote, biometric, game testing to develop deeper insights into the usability and experience of your game:
Table of Contents
How to use eye tracking for better game development
With hardware, the process is as simple as sticking one of these devices on the bottom of your monitor and plugging it into a USB port. So why isn’t it everywhere? Eye tracking has been around for a few years, occasionally popping up on Twitch or YouTube streams as eye tracking challenges, but from a game developer perspective, it has been labeled as a novelty, when it is in fact a valuable tool for improving your game. This is due to a few reasons.
One main reason is a general lack of expertise in how to apply this technology to gain meaningful insights into gaming. The hardware companies that make the screen-based eye trackers that you attach to the monitor are good at making hardware, but it is largely up to you, the GUR tester, to figure out how to use it to improve your first-time user experience.
Large developers have in-house teams ready to test build as soon as they are ready. In most cases, they either need to hire new experts in eye tracking or purchase software and training for their current team, from a company such as iMotions.
Here are a few hints at how to use eye tracking data effectively. Firstly, due to the nature of biometrics testing, you aren’t going to need as many people to test per study.
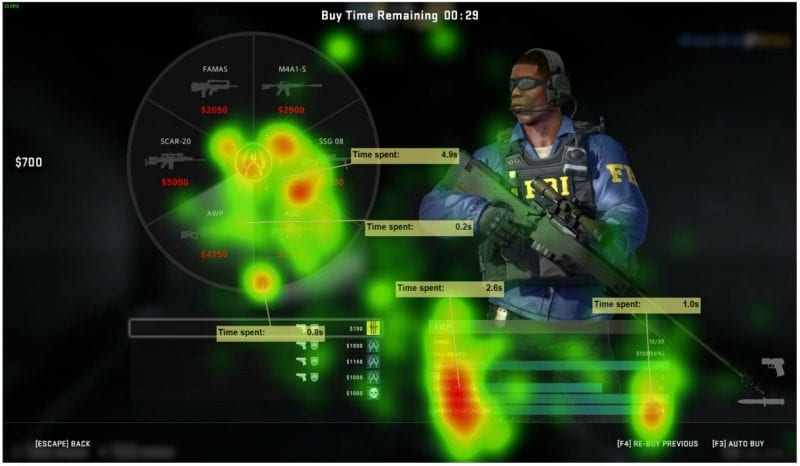
Game eye tracking works better in small iterative designs where you test old and new designs in the same session. That way you can use the heatmaps and eye gaze plots to answer questions like, “Does this new design make it easier to find and understand option x.”
Another useful piece of information that eye tracking in gameplay can reveal is insights into the usage of different on-screen elements like minimaps during gameplay as the user learns the game. At a high level, the amount of time in total spent looking at the minimap may reveal how quickly novice gamers can transition from learning the basic mechanics to higher skills and strategies.
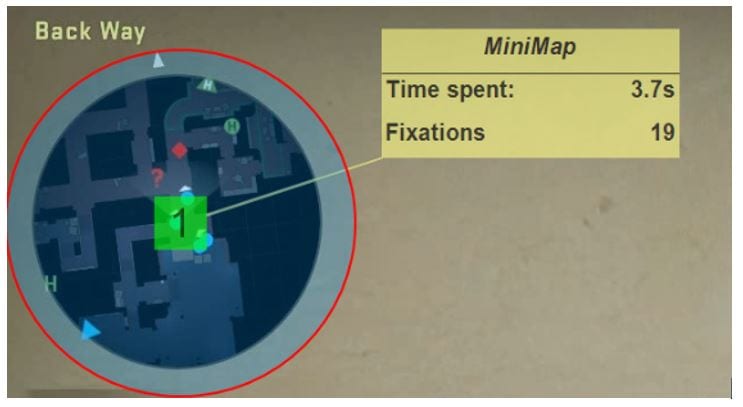
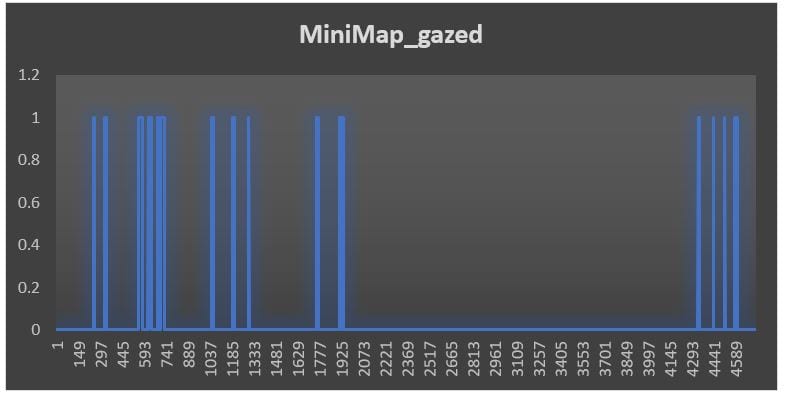
This can give a more granular answer to the question, “Is my game easy to master?” If you want to drill down on behavior you could plot map usage across a session to get a profile of user behavior. Then you can seek to tweak the design to achieve better results such as encouraging new players to use the map more, thus achieving more in-game success and hopefully leading to better player retention.
Finally, don’t forget to do demographic, comparative analysis. In the rush to get insights, it may be tempting to look only at the whole test group data to see if your game is testing well. Segmenting the insights based on people’s different experience levels, age and other factors may prove even more valuable.
How to use Facial Expression Coding for better questions
Facial Expressions Analysis involves using a video of a user’s face, captured by a camera, and then running it through an AI software that can generate data of expressed facial emotions frame by frame.
On the face of the problem (pardon the pun), it can seem easy to understand how to use facial expressions to predict game quality, i.e. if they look happier/smiling more, it means that the game is better. It can be tempting to simply record the playtest sessions and be done with it.
However, you will quickly find that expressed facial emotions are more complex and that there are pitfalls in the oversimplified assumption that facial expression equals felt emotion. For instance, are you testing gameplay vs. cinematics vs. a reward screen? Each of these aspects has different emotional profiles that need to be accounted for in the biosensor-based playtest design.
One approach is to look at any expression, regardless of whether it is positive or negative, as overall emotional engagement. This metric could be used by developers to thread the fine line between fun and permanent rage quitting.
I highlight this in the graph below. The data shows what my facial expression data looks like for a single round, with total gameplay on the left bars and the results screen on the right. Each of the colored bars represents the overall positive, negative, and neutral expressivity.
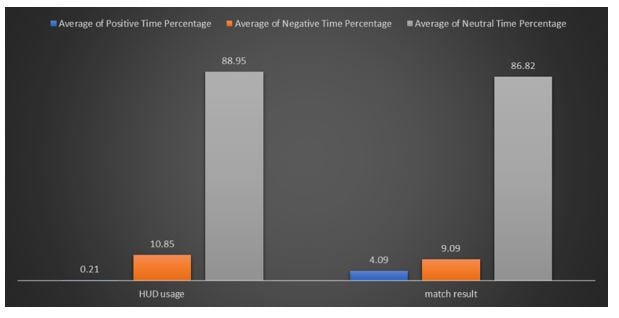
At first glance, I expressed more negative facial emotion than positive, but the question is then; is that result reflective of my overall game user experience or my performance within the game?
You can begin to see how difficult it is to use facial expressions in this way to answer questions of overall general game quality. The other result that is sometimes unexpected for people looking at facial expression data for the first time is the amount of neutral expression, which was present 85-90% of the time.
The results, however, make more sense if you take into consideration that facial expressions evolved really as a tool for communication rather than a pure indicator of emotional state. Humans, as social creatures, are not programmed to interact with computers socially (well not yet anyway), so there is a tendency to default to a blank face much of the time when concentrating or immersed in a non-social task.
This shows up a lot in media watching as well, such as testing TV shows and movies. But this doesn’t negate the important instances when facial expressions are displayed. So how then could facial expression data be used to generate real insight into a player’s game UX?
With this information in mind, game researchers can then rescope design questions to understand things like player immersion and flow as predictors of reported enjoyment.
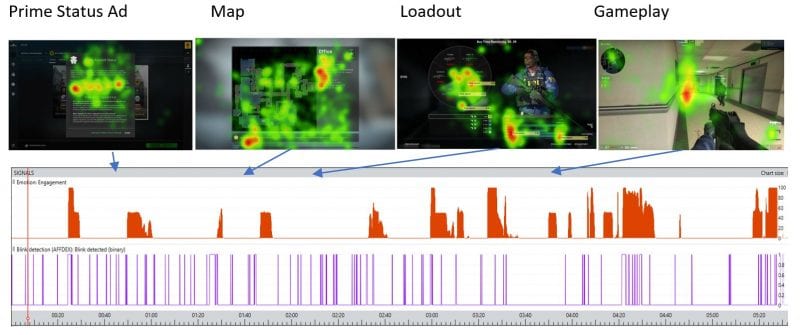
Charting the average facial engagement as the game progresses shows evidence for an increase in emotional investment as the game went from loading screen to match result. This is a positive result, as you generally would want to see an increase in psychological investment as the game progressed.
How to use skin conductance or electrodermal activity (EDA) to record a game player’s cognitive state
Out of the tools mentioned thus far, electrodermal activity (EDA) may be the most unfamiliar to you. If you think of the game experience like reading a book, then you can think of EDA as a way to tag every sentence the reader/player found interesting. Thus, giving huge insight into what was impactful and what wasn’t, even when the tester isn’t really able to verbalize their feelings.
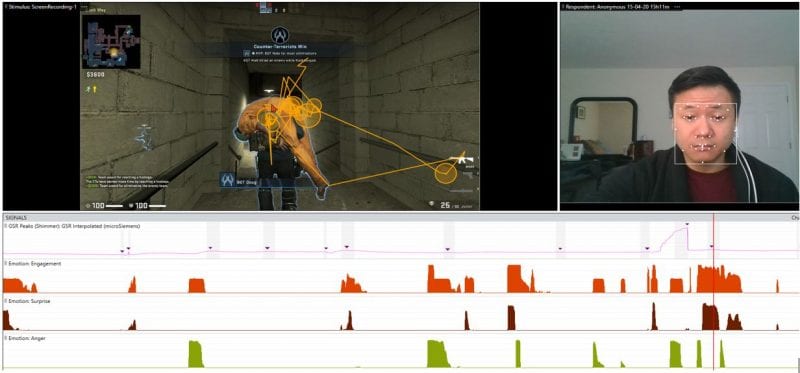
Electrodermal activity (EDA), or sometimes named galvanic skin response (GSR), is a sensor that measures how much sweat is currently being produced by the skin. In this test, I used a Shimmer GSR device that wears like a typical wristwatch with two wires stuck to my left hand with Velcro. The device didn’t interfere with my WASD function and after a second, I forgot it was there.
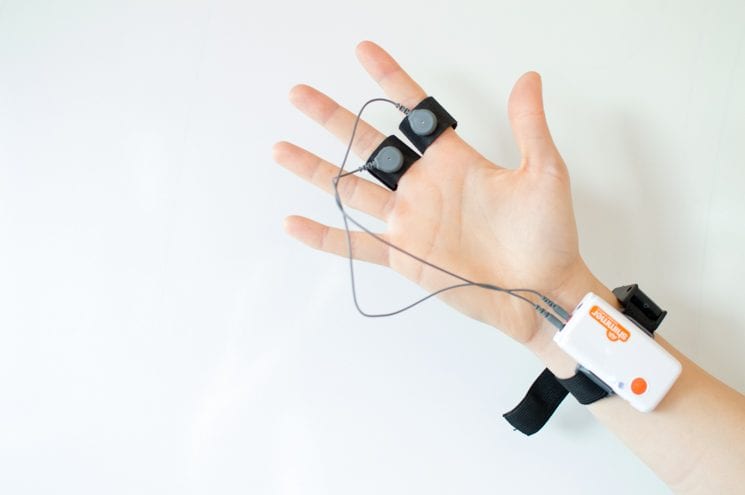
EDA is sometimes associated with images of a large lie detector apparatus with lots of wires and complicated squiggly lines. In reality, it is much simpler to understand than you may think. Remember the concept of fight or flight, which describes a human internal system that activates based on environmental factors such as threats.
Skin conductance measurement taps into a player’s cognitive and emotional state.
The way it works is that there are certain places on the human body that are sensitive to the emotional states of the person. If you have ever been nervous in front of a crowd, you may have noticed these areas profusely sweating, such as the palms, feet, or forehead.

The cool thing is that this effect is not an all-or-nothing response. It is proportional to the current state of the player and can be used to detect even small changes that would otherwise be invisible. One thing to know is that the response is not tied to the type of emotion being felt. To the data, sweating looks pretty much the same whether it is caused by walking into an ambush or celebrating a comeback victory.
So how do you use this data? The results of EDA analysis are often reported in terms of the amount of emotional relevance, investment, activation, or arousal produced by an experience.
This indicates some kind of change from a calm state indicated by a peak, but not which direction (i.e. whether or not the experience was positive or negative). Typically, the raw values from the skin need to be processed via an algorithm to extract things, i.e. the number of exciting moments experienced by the user or the size of those responses, since looking at the raw trend lines doesn’t provide much insight.
The analysis process used to be much more manual, but it has become much simpler now with the iMotions R-notebook function, which does the processing for you with the push of a button.
Looking at the replay of my session, I noticed a few things. In the beginning, where I was in the loading and setup screens, there were two areas where my skin conductance showed a significant response.
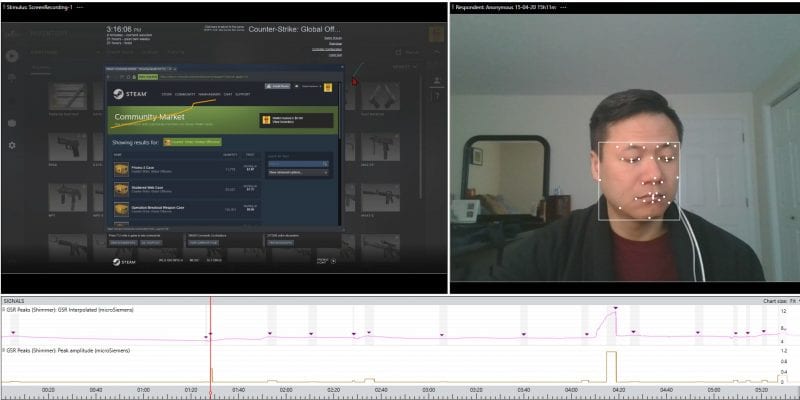
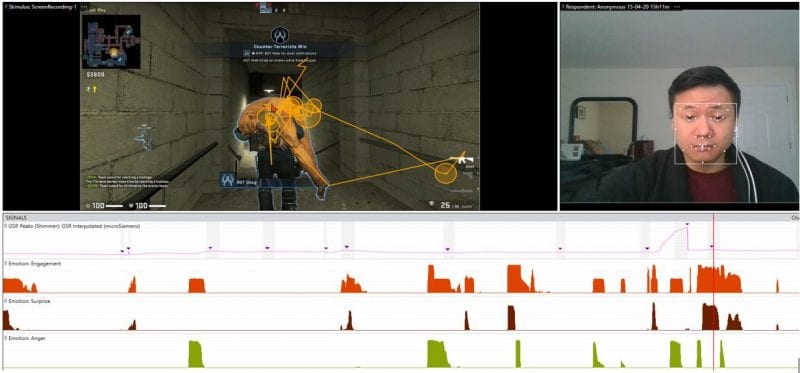
Both examples highlight the contribution of EDA as a measure of the understanding of overall general UX. In one scenario, I was feeling frustrated and the other, I was experiencing a complex mix of emotions. Here we see the usefulness of EDA, as granular markers of emotional driving moments, within the flow of the game. By examining the points where these tend to occur, designers can then ensure the game flows emotionally as expected and where they need to improve the experience to make it more exciting.
How multiple biometric sensors give better insights
Combining the various data results with my self-report shows that my return to the world of CS:GO was an overall very positive experience, but not a perfect experience. Overall, data from the facial expression and GSR reflected the fun I had during gameplay, but also some of the initial struggles with getting used to the interface, especially under time pressure.
Attentional maps revealed changes to the UI that could help me, such as increasing the awareness of the fund amount as well as making the gun properties in the loadout easier to decipher.
The main takeaway is that this testing was able to be done from home with biometric sensors I could carry home in my pocket. The ability for me to synchronize the data with my gameplay in iMotions allowed me to gain better insight into my overall gaming experience and highlight areas for game development to help with usability.
For more on these solutions, check out our free brochure on UX with iMotions.
Download iMotions
UX Brochure
For Beginners and Intermediates

Nam Nguyen has over 15 years of experience in developing the vision, design, optimization, and analysis protocols of cutting edge research in multiple industries.
He is a Neuroscience Product Specialist at iMotions, using his background in cognitive neuroscience methodology and passion for sensors and technology, to help enable research for human behavior.



![Featured image for Virtual Reality Immersion Tested: How Biosensors Reveal the Power of VR [A Case Study]](https://imotions.com/wp-content/uploads/2023/01/pexels-eugene-capon-1261824-300x169.jpg)
