
Multimodal Data Synchronization can reveal far more about human behavior than any single measurement. But what happens when the data don’t line up? Explore the hidden challenges of multimodal research, from synchronization errors and mismatched signals to the practical differences between custom-built systems and integrated platforms like iMotions Lab.
Table of Contents
Introduction: the study behind the study
Start an eye tracker and an EEG system at the same momenStart an eye tracker and an EEG system at the same moment, and by the end of the session they may disagree about when things happened by a tenth of a second or more. In one validation study, the timing error between the two grew trial by trial until it reached 485 ms (Xue et al., 2017). Nothing in either recording on its own would have flagged it. That is the quiet problem at the heart of multimodal research: the deciding factor is rarely which sensors you own, but whether their data can be trusted to line up.
A recent study in Frontiers in Human Neuroscience makes a good example (Deng, 2026). Fifty participants viewed three automobile cockpit designs and rated each one for attractiveness, innovativeness and friendliness. While they looked, the lab recorded four signals at once:
- EEG from a 64-channel system, sampled at 1,000 Hz
- Eye tracking from a screen-based eye tracker at 600 Hz,
- Electrodermal activity (EDA) from finger electrodes on a physiology amplifier
- ECG from a Lead II configuration on the same amplifier
The headline of the paper is a machine learning model that predicts the ratings from the combined signals. But read the methods section and a second story appears. Before any modeling could happen, the team had to align four devices from three manufacturers, each with its own clock, sampling rate, units and noise profile.
They used Lab Streaming Layer (LSL), controlled through the OpenViBE platform, to tie the streams together. They then had to decide, signal by signal, which measures could validly be computed from a six-second viewing window, and which could not.
None of that work shows up in the results tables. All of it determines whether the results mean anything.
This article is about that hidden layer. The cockpit study is our running example, but one study cannot carry the argument alone, so we also draw on meta-analyses, a systematic review, consumer research and timing-validation studies to show how general these issues are.
We look at why combining biosensors is worth the effort, what actually makes integration hard, how do-it-yourself pipelines compare with integrated platforms, and what to check before you trust any multimodal setup, including ours.y multimodal setup, including ours.
Why combine signals at all
No single biosensor tells the whole story, because each one looks at a different system. Eye tracking shows where attention goes. EEG shows how the cortex processes what is seen. EDA and ECG show how the autonomic nervous system responds. Facial expression analysis shows what reaches the face. Put together, they describe a response from several angles at once.
The cockpit study illustrates this neatly. When the model learned how much weight to give each signal, the answer depended on the question:
- Attractiveness leaned mostly on eye tracking (about 63% of the model’s weighting)
- Innovativeness leaned mostly on EEG (about 73%)
- Friendliness leaned mostly on peripheral physiology, meaning EDA and ECG (about 71%)
Those weights describe how one model used its inputs, not a law of nature, and the author is careful to say so. The broader point holds, though. Different questions draw on different systems, and a setup with only one sensor would have been strong on one question and weak on the other two.
The broader evidence
The cockpit study is a single experiment with three designs, so it should not carry this argument on its own. Larger bodies of evidence point the same way, with an important caveat about the size of the effect.
| Study | What was combined | What it found |
| Usman et al. (2025): 42 participants browsing 144 supermarket products | EEG and eye tracking | Buy or no-buy prediction reached 74% accuracy from EEG alone, 65% from eye tracking alone and 80% from both, using comparable pipelines |
| Byrne et al. (2022): systematic review of 174 neuromarketing papers | EEG with eye tracking, facial expression analysis and other measures | Frontal alpha asymmetry and the LPP were the most consistent EEG markers of preference, and their predictive accuracy improved most when combined with eye tracking or facial expression analysis |
| Zheng et al. (2019) | EEG and eye movements | Combining the two significantly outperformed either signal alone. EEG was better at recognizing happiness, while eye movements were better at recognizing fear |
| D’Mello & Kory (2015): meta-analysis of 90 multimodal systems | Mostly audio and video, with physiology in some systems | Multimodal systems beat their best single modality in 85% of cases, by 9.83% on average (median 6.60%) |
Two lessons stand out. First, the gain from combining signals is consistent but usually modest. D’Mello and Kory found that improvements were about three times smaller for naturalistic data (4.59%) than for acted expressions (12.7%). Multimodal research is not magic, and claims of dramatic gains deserve scrutiny.
Second, the complementarity is real. Different signals succeed and fail in different places, which is exactly why combining them helps. It is also why the combination is only as good as the alignment between them.
There is a second reason to combine signals: they help interpret each other. A rise in skin conductance tells you arousal increased, but not why. Gaze data can show what the participant was looking at when it happened. A change in pupil size might reflect effort, or simply a brighter part of the screen, and eye position helps tell the two apart (Mathôt, 2018). Signals that are ambiguous alone often become interpretable together.
The same logic applies to self-report. Physiology does not replace what participants tell you. As the cockpit study notes, predicting ratings from biosignals shows that the two correspond, not that one is a truer version of the other (Mauss & Robinson, 2009). The value lies in triangulation: stated preference, behavior and physiology, recorded together and compared.
All of this depends on one condition. The signals must share a timeline you can trust.
Anatomy of a multimodal setup
Every sensor in a multimodal lab produces a different kind of data, at a different rate, about processes that unfold on different timescales. The table below gives typical ranges. Exact values depend on the device and the protocol.
| Signal | What it measures | Typical sampling rate | Unit | Timescale of the response |
| EEG | Electrical activity of the cortex | 250 to 2,000 Hz | μV | Milliseconds (ERP components within roughly 100 to 800 ms) |
| Screen-based eye tracking | Gaze position, fixations, saccades, pupil size | 60 to 1,200 Hz | Pixels or degrees; mm for pupil | Fixations of a few hundred ms; pupil responses over about 1 to 3 s |
| Webcam eye tracking | Gaze position | About 30 Hz | Pixels | Coarser attention patterns over seconds |
| EDA / GSR | Sweat gland activity driven by the sympathetic nervous system | Roughly 4 to 128 Hz | μS | Phasic responses start 1 to 3 s after a stimulus and take seconds to recover |
| ECG | Electrical activity of the heart | 250 to 1,000 Hz | mV | Beat-to-beat changes over seconds; HRV needs windows of minutes for many metrics |
| Facial expression analysis | Facial muscle movements from video | 25 to 60 frames per second | Probability or evidence scores | Expressions over hundreds of ms to seconds |
| Respiration | Breathing rate and depth | 25 to 100 Hz | Arbitrary units or mV | Breath cycles of several seconds |
Three things stand out. First, sampling rates span roughly three orders of magnitude, from webcam frames to EEG samples. Second, the units have nothing in common, so signals cannot be compared or combined until they are scaled. Third, and most often overlooked, the responses themselves happen at very different speeds. An ERP component is over in under a second. A skin conductance response has barely started by then.
Each of these differences creates its own integration problem. The next four sections take them one at a time.
Challenge 1: getting time right
The central problem of multimodal research is that every device keeps its own time. An EEG amplifier, an eye tracker and a physiology box each have an internal clock, and none of them knows what the others are doing. Getting those clocks onto one shared timeline involves several separate problems.
Offset
Devices start recording at slightly different moments, and their timestamps begin from different reference points. A constant offset between two streams is the simplest error. It is also easy to miss, because the data look perfectly normal on their own.
Drift
No two hardware clocks run at exactly the same rate. Tiny differences accumulate over a session, so two streams that were aligned at the start can be tens of milliseconds apart by the end. Correcting for drift requires repeatedly measuring the relationship between clocks, not just once at the start. This is one of the core jobs of synchronization frameworks such as LSL, which estimates clock offsets continuously and stores them alongside the data (Kothe et al., 2025).
Transmission latency and jitter
Data do not arrive at the recording computer the instant they are measured. USB, Bluetooth and network connections add delays, and those delays vary from packet to packet. Wireless devices are particularly prone to buffering. If samples are timestamped on arrival rather than at measurement, that variable delay becomes timing error.
Stimulus onset
The moment software tells a screen to show an image is not the moment the image appears. Monitors refresh at fixed intervals (every 16.7 ms at 60 Hz), and displays add their own processing delay. Large comparisons of experiment software show that timing precision varies across packages, operating systems and hardware, and that online studies are less precise than lab studies (Bridges et al., 2020). For any analysis locked to stimulus onset, the true onset is what counts. A photodiode on the screen is the standard way to measure it.
Event markers
Markers tell you when something happened in the experiment: a stimulus appeared, a participant pressed a key, a video reached a scene change. Hardware triggers, typically TTL pulses sent directly to an amplifier, are precise because they skip the software stack. Software markers are more flexible but inherit whatever latency the software has. Most serious setups use both, and know which one to trust for which purpose.
What validation studies show
These problems are not theoretical. When researchers measure timing directly, errors of tens or even hundreds of milliseconds turn up unless synchronization is handled carefully.
- The method matters as much as the hardware. Xue et al. (2017) tested four ways of co-registering the same 300 Hz screen-based eye tracker with the same 1,000 Hz EEG system. The two setups built from standard integration guides produced cumulative timing errors averaging 68 ms and 216 ms, which grew from trial to trial and reached up to 485 ms in the worst case. A custom program written for the task, with direct access to the eye tracker’s clock synchronization, kept the mean error near zero (about 2 ms, with a standard deviation of 17 ms) and showed no accumulation.
- Offset and jitter in VR. Larsen et al. (2024) combined EEG with the eye tracker built into a VR headset and measured an average offset of 36 ms between the two streams, with a mean jitter of 5.76 ms. Some offset is to be expected whenever separate devices are combined, regardless of the software that records them.
- A known, constant offset can be corrected. An unmeasured one subtly shifts every fixation-locked analysis, which is why it is worth measuring on your own setup rather than assuming it is zero.
Two conclusions follow. First, the same hardware can be well or poorly synchronized depending on how it is connected, so precision has to be engineered and verified rather than assumed.
Second, the best result in Xue’s study came from purpose-built code. For a specialized question with demanding timing requirements, such as fixation-locked EEG with one specific pair of devices, a dedicated pipeline built and validated by an experienced team can be tuned to exactly what that study needs. What a custom build does not provide is consistency.
Every new device, study design or team member means building and validating again. That is where an integrated platform earns its place: it delivers the same validated synchronization across every study, sensor combination and researcher in the lab, without each project starting from zero.
Why milliseconds matter
How much precision you need depends on the analysis. For EDA, where responses unfold over seconds, a 50 ms error rarely matters. For EEG it can be decisive. ERP components are defined by their timing, and inconsistent alignment across trials smears them out when trials are averaged. Combined EEG and eye tracking makes the demands even tighter. Analyses locked to the start of each fixation, known as fixation-related potentials, need the two streams aligned to within a few milliseconds (Dimigen et al., 2011).
The practical rule: decide what precision your analysis needs, then verify that your setup actually delivers it. Do not assume.
Challenge 2: signals that live on different timescales
Perfect synchronization solves only half the timing problem. The other half is that the body responds at different speeds, and every analysis window has to respect that.
Consider a single image shown for six seconds, as in the cockpit study. Within that window:
- Early visual ERPs appear within the first 100 to 200 ms
- The participant makes perhaps a dozen or more fixations, each lasting a few hundred milliseconds
- A task-evoked pupil response builds and peaks after one to three seconds
- A skin conductance response begins one to three seconds after the relevant event and may not have recovered before the window ends (Boucsein et al., 2012)
- The heart beats perhaps six to eight times
A window that suits one signal can be wrong for another. Cut the analysis at one second and you capture the ERPs but miss almost all of the electrodermal response. Use the whole six seconds for EEG and you dilute fast, stimulus-locked activity with everything that came after.
A case in point: heart rate variability
The cockpit study offers a clear example of a measure that could not survive a short window. The author excluded the standard frequency-domain HRV measures (LF power, HF power and the LF/HF ratio) from the analysis entirely. The reason is simple arithmetic. The low-frequency band starts at 0.04 Hz, and one cycle at that frequency lasts 25 seconds. A six-second recording cannot contain even one full cycle, and sampling the ECG faster does not fix a window that is too short.
The study kept only RMSSD and SDNN, two time-domain measures, and noted that even these are less reliable over ultra-short windows than over the longer recordings HRV guidelines usually assume (Laborde et al., 2017; Shaffer & Ginsberg, 2017). The LF/HF ratio has a further problem: it is widely read as “sympathovagal balance”, an interpretation the evidence does not support (Billman, 2013).
The lesson is general. Integration is not finished when the streams are aligned. Each metric needs a window that matches its physiology, and some metrics simply do not belong in some designs.
Practical consequences
- Define windows per signal, not one window for everything
- Choose metrics the design can support. Short stimuli suit ERPs, gaze metrics and phasic EDA. Tonic measures and HRV need longer exposures or block designs.
- Leave room for slow responses. Inter-stimulus intervals that are too short let one trial’s EDA response bleed into the next
- Report the windows. Reviewers and readers cannot evaluate a physiological measure without knowing what time span it was computed over
Challenge 3: artifacts, quality control and missing data
In a multimodal setup, problems rarely stay in one stream. The body that produces the signals also produces noise, and the same movement can show up in several sensors at once.
Artifacts that cross modalities
- Eye movements and blinks in EEG. Every blink and saccade produces large electrical signals that spread across the scalp, especially at frontal electrodes. Recording gaze alongside EEG is one of the most effective ways to identify and correct these artifacts (Plöchl et al., 2012).
- Muscle activity in EEG. Jaw clenching, swallowing and facial movement add high-frequency noise, which is why gamma-band power is so sensitive to muscle artifacts. Facial expressions and EEG frontal channels can therefore interfere with each other.
- Head movement. Movement degrades eye tracking accuracy and can shift EEG electrodes, which produces artifacts in both streams at once.
- Luminance and pupil size. Pupil diameter responds strongly to light and is also affected by where the eye is looking on the screen. Stimuli that differ in brightness, like cockpit renderings with different color schemes, can produce pupil differences that have nothing to do with cognition (Mathôt & Vilotijević, 2023; Steinhauer et al., 2022).
- Breathing and EDA. Deep breaths and sighs can trigger skin conductance responses unrelated to the stimulus. A respiration belt helps identify them.
These overlaps are a reason to integrate carefully, but also a benefit of doing it. A synchronized gaze stream makes EEG cleaner. A respiration channel makes EDA easier to interpret.
Quality control across streams
Each modality has its own quality criteria: impedance and bad channels for EEG, calibration accuracy and tracking ratio for eye tracking, signal range and electrode contact for EDA, beat detection for ECG. A multimodal study adds a further question. What happens to a trial when one stream is good and another is not?
There is no universal answer. You can drop the trial entirely, keep it for the analyses that do not need the failed stream, or impute the gap. What matters is deciding before data collection and applying the rule consistently. The cockpit study, for example, set prespecified multimodal quality criteria and reports that all 150 trials passed them.
Catch problems while the participant is still there
The cheapest fix for bad data is noticing it during the session. A loose EDA electrode, a drifting eye tracker calibration or a Bluetooth sensor that keeps dropping out can all be corrected in seconds if someone sees it happen. Seen afterwards, the data are simply lost. Live monitoring of every stream on one screen is one of the most practical reasons to integrate at the point of collection rather than merging files afterwards.
Challenge 4: from synchronized data to sound analysis
Once the streams are aligned and cleaned, they still have to be analyzed, and multimodal data magnify four familiar traps.
- Feature definitions. Microvolts, microsiemens and milliseconds must be turned into comparable features, and each feature needs a precise definition. “SCR amplitude” can mean the largest response, the mean or the sum within a window.
- Many features, few participants. Several sensors quickly produce hundreds of variables, but participant numbers rarely keep pace. Models then fit noise, and cross-validation estimates become unstable (Varoquaux, 2018).
- Repeated measures. The cockpit study’s 150 trials came from 50 people viewing the same three designs, so they are not 150 independent observations. Mixed-effects models account for this (Bates et al., 2015).
- Leakage. Scaling, selecting features or tuning settings on the full dataset before splitting it lets test participants leak into training and inflates results (Kapoor & Narayanan, 2023; Rosenblatt et al., 2024).
A single, consistent processing pipeline makes all four easier to control.
DIY or integrated: an honest comparison
There are two broad ways to build a multimodal lab. Both can produce excellent science, and the right choice depends on who will run it.
The do-it-yourself route
The most common open-source approach combines Lab Streaming Layer with a stimulus presentation tool such as PsychoPy, a recorder such as LabRecorder, and analysis in Python or MATLAB. LSL deserves real credit here. It is free and open, supports more than 150 classes of acquisition devices, timestamps every sample, and corrects for clock offsets continuously to achieve millisecond-level synchronization (Kothe et al., 2025). The cockpit study used exactly this kind of approach.
The DIY route has genuine strengths. It costs nothing in licenses, it can be modified at every level, its methods are fully transparent, and it has a large research community behind it.
Its costs are less visible but real:
- Engineering time. Someone has to configure each device, write the experiment, connect the streams, test the timing and build the analysis pipeline. For a new setup this is often weeks of work.
- Validation is your job. The framework makes precise synchronization possible. Verifying that your particular combination of devices, drivers and computers achieves it is up to you.
- Fragility over time. Scripts break when operating systems, drivers or device firmware update. A pipeline that worked last year may not work today.
- The person problem. In many labs, one doctoral student or postdoc understands the whole pipeline. When they leave, that knowledge often leaves too.
- Assembly at the analysis stage. Recorded streams still need to be loaded, aligned to events, cleaned and combined, usually with separate tools for each modality.
The integrated route
An integrated platform handles study design, stimulus presentation, synchronization, live monitoring and analysis in one environment. Its advantages are mostly the inverse of the DIY costs: faster setup, validated device connections, consistent processing, and a system that new lab members can learn without inheriting someone’s code.
Its costs are just as real. It comes with license fees. It ties part of your workflow to a vendor. And it can give you less low-level control than writing everything yourself.
Side by side
| Consideration | DIY (for example LSL with PsychoPy and custom scripts) | Integrated platform |
| License cost | None | Annual license |
| Setup time for a new study | Days to weeks, depending on experience | Typically hours to days |
| Timing validation | Built and verified by the lab | Device integrations validated by the vendor; still worth checking in your own lab |
| Flexibility | Unlimited, at the cost of effort | High within supported devices and features; extendable through APIs and LSL |
| Live monitoring of all streams | Possible, but must be assembled | Built in |
| Analysis | Separate tools per modality | Shared timeline and modality-specific processing in one place |
| Resilience to staff turnover | Depends on documentation | Relies on the platform, not a person |
| Best fit | Method development, brain-computer interfaces, unusual hardware, labs with dedicated engineers | Applied research, teaching labs, commercial research, multi-user facilities |
It does not have to be either/or
The choice is less binary than it looks. Integrated platforms increasingly accept LSL streams, which lets labs add devices that are not natively supported. Data can also flow the other way, from the platform to custom analysis code. Many labs end up with a hybrid: an integrated core for the everyday work, with open tools at the edges.
The real question is not which approach is better in principle. It is where your team’s time is best spent. If building and maintaining the pipeline is part of your research, DIY is a natural fit. If the pipeline is simply the thing standing between you and your research question, integration buys that time back.
What native integration looks like in iMotions Lab
iMotions Lab was built around the problems described above, it’s prime task os data synchronization. Its core job is to bring study design, stimulus presentation, data collection, synchronization and analysis into one environment, so that researchers spend their time on the research question rather than on the plumbing.
One study, one timeline
In iMotions Lab, the study itself is the anchor. You design it in the software, with images, video, live websites, surveys, mobile apps, VR environments or real-world setups as stimuli, and with randomization, block designs and participant groups set up by point and click. Because the software presents the stimuli and records the sensors, every stream is placed on the same timeline as the events that drive it. There is no separate step of matching a log file from the presentation software to recordings from each device.
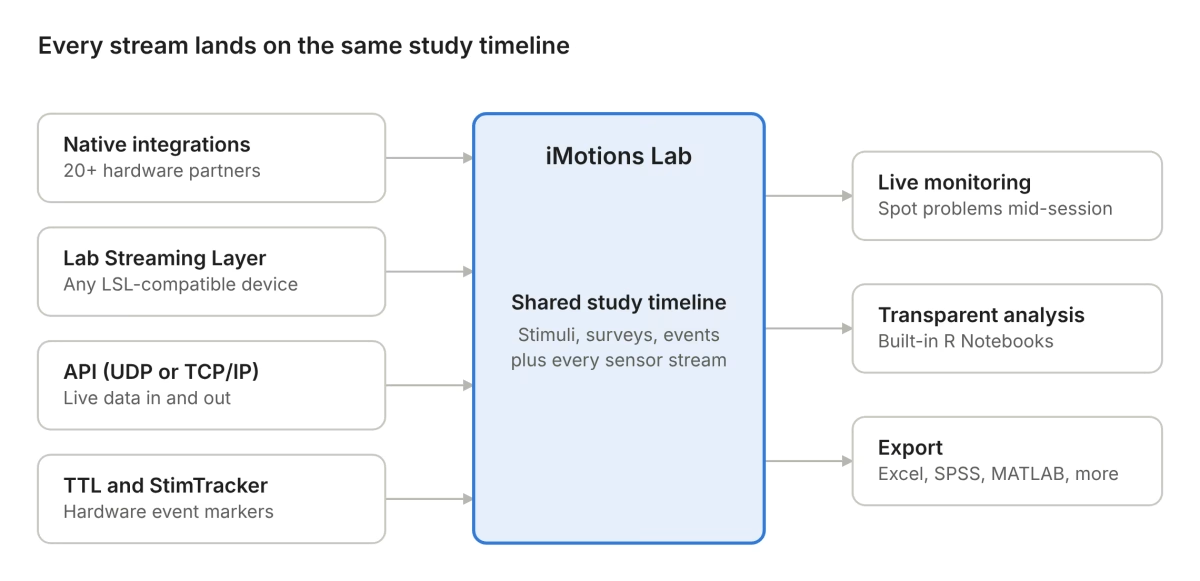
Native devices, LSL streams, API data and hardware triggers all feed one study timeline, which then drives live monitoring, analysis and export.
Native hardware integrations
iMotions is hardware agnostic and integrates more than 50 sensors from over 20 hardware partners. Native integrations currently cover brands across every major modality, including:
| Modality | Natively integrated brands (examples) |
| Screen-based eye tracking | Smart Eye, Gazepoint, EyeTech |
| Eye tracking glasses | Pupil Labs, Argus Science, Viewpointsystem |
| VR eye tracking | Varjo, Vive |
| EEG | Brain Products, Advanced Brain Monitoring, Neuroelectrics, Neurable |
| fNIRS | Artinis |
| EDA, ECG, EMG and respiration | Biopac, Shimmer Research, Plux Biosignals, Empatica, Polar |
| Response devices and simulators | Cedrus, VI-grade |
A native integration means the device connects directly to iMotions Lab, streams into the shared timeline, and has modality-specific processing available in the software.
Software modules for each signal
Each modality is handled by its own module, including screen-based, glasses, VR and webcam eye tracking, EEG, fNIRS, EDA/GSR, ECG, EMG, respiration, facial expression analysis, voice analysis, motion capture from video and GPS. Modules come with the processing that modality needs, such as fixation detection and areas of interest for gaze, or peak detection for skin conductance. Adding a modality to a study means adding a module, not writing a new pipeline.
Open where it counts: LSL, API and TTL
Native integrations do not limit you to native devices. iMotions Lab accepts Lab Streaming Layer streams, so any LSL-compatible device can join the same timeline. Devices outside the native list can be brought in this way wherever an LSL stream is available. The iMotions API supports live data streaming in and out over UDP or TCP/IP, so data can be forwarded to other software in real time or sent into iMotions from custom systems. Externally recorded data can be imported for synchronization and analysis, and TTL triggers are supported for hardware-level event marking.
In other words, the integrated platform and the open-source ecosystem are not competitors here. LSL extends what iMotions can connect to, and the API lets iMotions feed whatever else is in the lab.
Stimulus onset is covered too. iMotions natively supports the Cedrus StimTracker, which uses light sensors on the screen to detect the moment a stimulus actually changes and writes it as an event marker into the EEG and eye tracking data. That is the photodiode check recommended earlier, built into the workflow rather than bolted on.
Live monitoring during collection
All connected streams are visible during the session. A detached electrode, a lost gaze signal or a dropped wireless connection shows up while the participant is still in the room, when it can still be fixed.
Transparent analysis
Processing in iMotions Lab runs through R Notebooks that are built in, transparent and customizable, so researchers can see exactly how each metric is computed and adjust it. Raw data, processed metrics and visualizations can be exported in formats suited to Excel, SPSS, MATLAB and other tools, which means the platform does not have to be the end of the analysis. The built-in survey tool, and an integration with Qualtrics, keeps self-report on the same timeline as physiology, so stated and measured responses can be compared directly.
Support behind the setup
Every license includes onboarding, training and technical support, along with a help center of more than 500 articles. For many labs, this matters as much as the software: the knowledge of how the setup works does not depend on one person staying in the lab.
In practice
At Arizona State University, researchers first built their own synchronization for an EEG headset. It worked, but as higher-end EEG systems and other sensors arrived, keeping a home-built solution running demanded ever more programming time and skill. After moving to iMotions, the lab could switch between devices freely. Associate professor Robert Atkinson put the change simply: he could focus on research questions instead of “fighting with the integration and synchronization issues” of multiple sensors.
At Northeastern University, Dr. Alessandro Canossa studies player behavior by combining biosensors with in-game events. Before iMotions, custom-coded synchronization limited him to simpler study designs, because even small timing inaccuracies could make a study unusable. With an integrated setup he now runs more complex designs in a fraction of the time, and the resulting work has won a best paper award.
Both stories make the same point as the validation studies above. Custom synchronization can work, but keeping it working across new devices and more ambitious designs is where labs lose time.
A checklist for evaluating any multimodal setup
Whether you build your own pipeline, buy a platform or combine the two, these are the questions worth answering before you collect data. They apply to iMotions as much as to anything else.
Timing
- What synchronization precision does each planned analysis actually need?
- Are samples timestamped at acquisition or on arrival at the recording computer?
- How are clock offset and drift between devices measured and corrected?
- Has stimulus onset been verified with a photodiode or similar measurement, not just taken from the software log?
- Are hardware triggers available for the analyses that need them, such as ERPs?
Devices and data
- Is each device natively supported, connected through a standard such as LSL, or held together by custom code?
- What happens when a wireless device drops out mid-session? Is the gap visible, logged and recoverable?
- Can all streams be monitored live during collection?
- Are raw data available for export, not only processed metrics?
Design and measurement
- Does each signal have an analysis window that matches its physiology?
- Are the planned metrics valid for the stimulus duration? For example, is frequency-domain HRV off the table for short trials?
- Are luminance and other low-level stimulus properties controlled, or at least measured, for pupil analyses?
- Are multimodal quality-control rules defined before data collection?
Analysis
- Is every feature defined precisely enough for someone else to reproduce it?
- Is processing transparent, so you can see how each metric is calculated?
- Does the statistical approach account for repeated measures within participants and shared stimuli?
- In predictive analyses, are all data-dependent steps fitted inside the training data only?
People and sustainability
- Could a new lab member run a study within a few weeks?
- Is the setup documented well enough to survive the departure of the person who built it?
- Who do you call when something breaks the week before a deadline?
A setup that answers these clearly is ready for multimodal research. A setup that does not is a risk to the data, however good the individual sensors are.
Conclusion
The cockpit study ends with a model that predicts how people rate a design from their brain activity, gaze and physiology. That result rests on work most readers never see: four devices aligned to one timeline, analysis windows matched to each signal, measures dropped because the design could not support them, and validation kept honest across participants.
That hidden layer is where multimodal research is won or lost. Sensors are the easy part. Integration, meaning time, timescales, artifacts and analysis handled consistently, is what turns several streams of data into one trustworthy picture of a human response.
There is more than one good way to build that layer. Open tools like LSL make it possible for any lab willing to invest the engineering effort. Integrated platforms like iMotions Lab exist so that labs can spend that effort on research instead, while staying open to the wider ecosystem through LSL, the API and TTL. Whichever route you take, the standard is the same: know what precision your questions need, and verify that your setup delivers it.
See it with your own sensors. If you are planning a multimodal lab, or struggling to keep an existing one in sync, book a demo and walk through your exact sensor combination with an iMotions specialist.
References
Bates, D., Mächler, M., Bolker, B., & Walker, S. (2015). Fitting linear mixed-effects models using lme4. Journal of Statistical Software, 67(1), 1–48. https://doi.org/10.18637/jss.v067.i01
Billman, G. E. (2013). The LF/HF ratio does not accurately measure cardiac sympatho-vagal balance. Frontiers in Physiology, 4, 26. https://doi.org/10.3389/fphys.2013.00026
Boucsein, W., Fowles, D. C., Grimnes, S., Ben-Shakhar, G., Roth, W. T., Dawson, M. E., & Filion, D. L. (2012). Publication recommendations for electrodermal measurements. Psychophysiology, 49(8), 1017–1034. https://doi.org/10.1111/j.1469-8986.2012.01384.x
Bridges, D., Pitiot, A., MacAskill, M. R., & Peirce, J. W. (2020). The timing mega-study: Comparing a range of experiment generators, both lab-based and online. PeerJ, 8, e9414. https://doi.org/10.7717/peerj.9414
Byrne, A., Bonfiglio, E., Rigby, C., & Edelstyn, N. (2022). A systematic review of the prediction of consumer preference using EEG measures and machine-learning in neuromarketing research. Brain Informatics, 9(1), 27. https://doi.org/10.1186/s40708-022-00175-3
Deng, M. (2026). Generative-augmented multimodal neuroaffective decoding for product evaluation: Toward neurofeedback-driven human-in-the-loop co-design. Frontiers in Human Neuroscience, 20, 1997654. https://doi.org/10.3389/fnhum.2026.1997654
Dimigen, O., Sommer, W., Hohlfeld, A., Jacobs, A. M., & Kliegl, R. (2011). Coregistration of eye movements and EEG in natural reading: Analyses and review. Journal of Experimental Psychology: General, 140(4), 552–572. https://doi.org/10.1037/a0023885
D’Mello, S. K., & Kory, J. (2015). A review and meta-analysis of multimodal affect detection systems. ACM Computing Surveys, 47(3), Article 43. https://doi.org/10.1145/2682899
Kapoor, S., & Narayanan, A. (2023). Leakage and the reproducibility crisis in machine-learning-based science. Patterns, 4(9), 100804. https://doi.org/10.1016/j.patter.2023.100804
Kothe, C., Shirazi, S. Y., Stenner, T., Medine, D., Boulay, C., Grivich, M. I., Artoni, F., Mullen, T., Delorme, A., & Makeig, S. (2025). The lab streaming layer for synchronized multimodal recording. Imaging Neuroscience, 3, IMAG.a.136. https://doi.org/10.1162/IMAG.a.136
Laborde, S., Mosley, E., & Thayer, J. F. (2017). Heart rate variability and cardiac vagal tone in psychophysiological research: Recommendations for experiment planning, data analysis, and data reporting. Frontiers in Psychology, 8, 213. https://doi.org/10.3389/fpsyg.2017.00213
Larsen, O. F. P., Tresselt, W. G., Lorenz, E. A., Holt, T., Sandstrak, G., Hansen, T. I., Su, X., & Holt, A. (2024). A method for synchronized use of EEG and eye tracking in fully immersive VR. Frontiers in Human Neuroscience, 18, 1347974. https://doi.org/10.3389/fnhum.2024.1347974
Mathôt, S. (2018). Pupillometry: Psychology, physiology, and function. Journal of Cognition, 1(1), 16. https://doi.org/10.5334/joc.18
Mathôt, S., & Vilotijević, A. (2023). Methods in cognitive pupillometry: Design, preprocessing, and statistical analysis. Behavior Research Methods, 55(6), 3055–3077. https://doi.org/10.3758/s13428-022-01957-7
Mauss, I. B., & Robinson, M. D. (2009). Measures of emotion: A review. Cognition and Emotion, 23(2), 209–237. https://doi.org/10.1080/02699930802204677
Plöchl, M., Ossandón, J. P., & König, P. (2012). Combining EEG and eye tracking: Identification, characterization, and correction of eye movement artifacts in electroencephalographic data. Frontiers in Human Neuroscience, 6, 278. https://doi.org/10.3389/fnhum.2012.00278
Rosenblatt, M., Tejavibulya, L., Jiang, R., Noble, S., & Scheinost, D. (2024). Data leakage inflates prediction performance in connectome-based machine learning models. Nature Communications, 15, 1829. https://doi.org/10.1038/s41467-024-46150-w
Shaffer, F., & Ginsberg, J. P. (2017). An overview of heart rate variability metrics and norms. Frontiers in Public Health, 5, 258. https://doi.org/10.3389/fpubh.2017.00258
Steinhauer, S. R., Bradley, M. M., Siegle, G. J., Roecklein, K. A., & Dix, A. (2022). Publication guidelines and recommendations for pupillary measurement in psychophysiological studies. Psychophysiology, 59(4), e14035. https://doi.org/10.1111/psyp.14035
Usman, S. M., Khalid, S., Tanveer, A., Imran, A. S., & Zubair, M. (2025). Multimodal consumer choice prediction using EEG signals and eye tracking. Frontiers in Computational Neuroscience, 18, 1516440. https://doi.org/10.3389/fncom.2024.1516440
Varoquaux, G. (2018). Cross-validation failure: Small sample sizes lead to large error bars. NeuroImage, 180, 68–77. https://doi.org/10.1016/j.neuroimage.2017.06.061
Xue, J., Quan, C., Li, C., Yue, J., & Zhang, C. (2017). A crucial temporal accuracy test of combining EEG and Tobii eye tracker. Medicine, 96(13), e6444. https://doi.org/10.1097/MD.0000000000006444
Zheng, W.-L., Liu, W., Lu, Y., Lu, B.-L., & Cichocki, A. (2019). EmotionMeter: A multimodal framework for recognizing human emotions. IEEE Transactions on Cybernetics, 49(3), 1110–1122. https://doi.org/10.1109/TCYB.2018.2797176