
We put our webcam respiration algorithm up against a gold-standard BIOPAC respiration belt in the lab, then took it into the homes of 205 remote participants watching ads and emotionally loaded images. Here’s what we found, and how to get good data from it.
Table of Contents
Breathing is one of the few physiological signals you can see with the naked eye. Watch someone during a penalty shootout, or in the moment a horror film goes suspiciously quiet, and you can read a fair amount from their shoulders alone.
That breathing tracks how people respond to what they see is not news, since decades of psychophysiology research point the same way. The more interesting question is whether an ordinary webcam can see it as reliably as the equipment researchers usually strap on.
That equipment is the respiration belt, a sensor cinched around the torso after the participant has breathed out completely. It works very well in a lab, and rather less well when your participants are 200 people sitting in their own living rooms, none of whom own one.
So we built an algorithm that measures breathing from webcam video. Then, because an algorithm nobody has checked is mostly an opinion, we tested it.
This post summarizes the white paper iMotions Web-Respiration Validation (Seernani, Gregoret, Korepanov, Wilson, & Jensen, 2024). It covers two studies: a lab comparison against a gold-standard BIOPAC respiration belt, and a remote study in which 205 participants watched ads and emotionally loaded images from home. Download the full white paper here.
A note on the webcam respiration source material
All figures in this post come from the white paper. Where we have simplified the statistics for readability, the full versions, plots included, are in the original.
What is webcam respiration?
The iMotions webcam respiration algorithm finds the person in the video using body feature detection (head, shoulders, arms, torso) and draws a region of interest around the chest. It then follows the small, visible movements of that region as the chest rises and falls, turning them into a respiration time series.
That signal is filtered to keep only the frequencies human breathing usually occupies, roughly 7.5 to 30 breaths per minute. Because people shift in their chairs and scratch their noses even when told to sit still, the algorithm also produces a quality score by comparing the filtered signal with the raw one, so you know how far to trust each stretch of data.

Why validate against a gold standard?
Two measures can correlate nicely and still disagree by a consistent margin, which is fine for spotting trends and less fine if you want to swap one for the other. That is why the lab study used Bland-Altman analysis alongside correlations. It shows the average gap between the two methods (bias) and how widely individual measurements scatter around it (limits of agreement).
Why measure breathing at all?
Respiration rate rises with sympathetic nervous system activity, which makes it a well-established indicator of arousal, alongside heart rate and heart rate variability (Shea, 1996). Research has also linked breathing patterns to the direction of an emotional response: amusement tends to shorten inhalation and speed up breathing, while disgust tends to lengthen it and slow breathing down (Boiten, 1998; Jerath & Beveridge, 2020).
Study 1: Webcam vs Respiration Belt
Aim of the study and methodology
The first study asked the obvious question: if you record the same people breathing with a webcam and a respiration belt at the same time, do you get the same answer?
Ten healthy adults (four female, aged 18 to 45) took part in the lab. Nobody had a history of respiratory conditions such as asthma or COPD, or a respiratory infection in the two months before. Smokers were excluded, and participants skipped caffeine, alcohol, sedatives and bronchodilators beforehand.
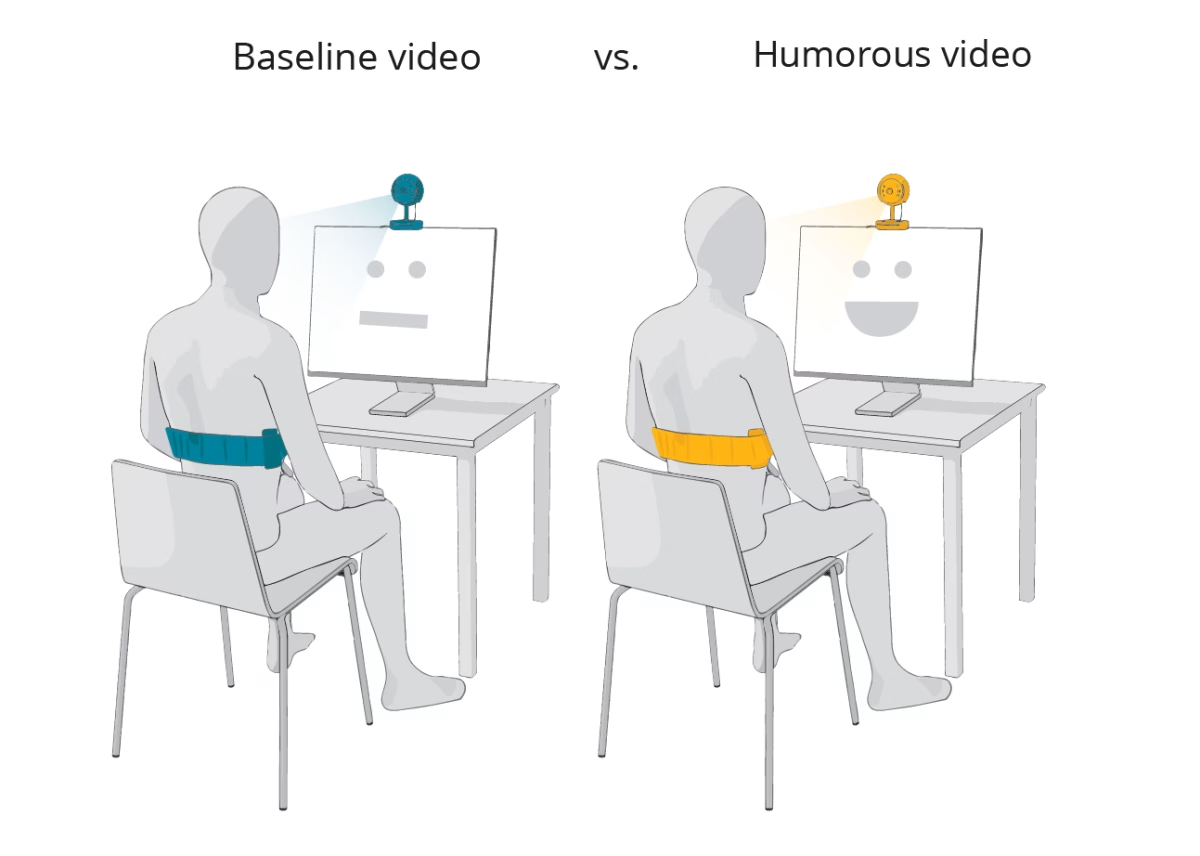
Each participant watched nine videos, between 30 seconds and three minutes long. A neutral baseline came first, followed by three randomized blocks of funny ads, emotional ads, and two image sequences, one pleasant and one designed to disgust. Participants were asked to sit as still as they could for the roughly 20-minute session.
The hardware was the kind that takes a while to put on. Breathing was recorded with a BIOPAC TSD201 respiration transducer around the torso, connected to a BIOPAC MP160 system with an RSP100C amplifier. A Polar H10 chest strap recorded heart rate and interbeat intervals, and a Logitech C920 webcam sat on top of the monitor. iMotions 10.1 presented the stimuli and synchronized everything.
Results
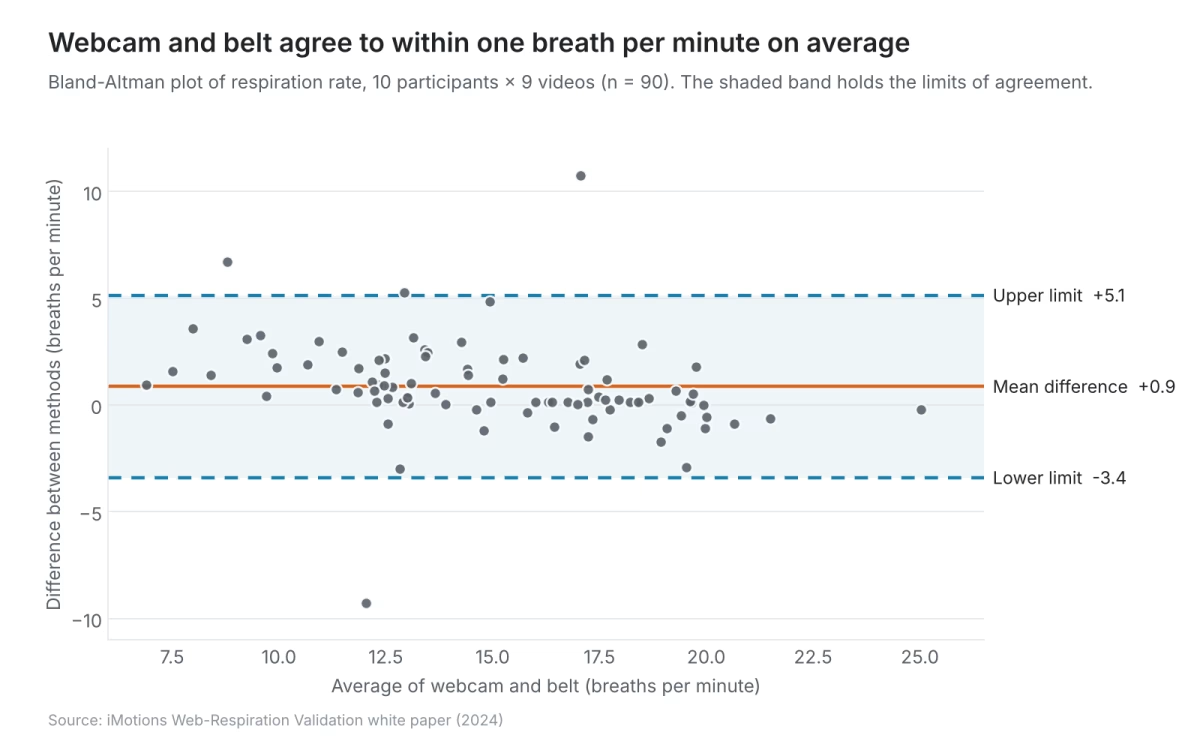
Ten participants watching nine videos each gave 90 paired measurements. We compared them in two ways.
Relative agreement. Intraclass correlation coefficients (ICC) showed good agreement for respiration rate, at 0.815 (interval 0.70 to 0.88), and moderate to good agreement for cycle count, at 0.739 (interval 0.42 to 0.87).
Absolute agreement. The Bland-Altman analysis is where the webcam had most to prove, and it held up. On average, the webcam differed from the belt by less than one breath per minute for respiration rate, and by less than one second for cycle duration.
The error also stayed flat across the range. In other words, the gap between the two methods did not widen as people breathed faster, which is what you want if you plan to use the webcam on content that gets people going.
Finally, Pearson correlations between the webcam and belt metrics were high (r > 0.8). Correlations between breathing and heart rate measures were low to moderate (r < 0.7). That is as it should be, since the two are related signals rather than the same one, and a method that correlated perfectly with heart rate would be measuring the wrong thing.
Study 2: Breathing at Home, Watching Ads
Agreeing with a belt in a quiet lab is one thing. The second study took the method to where it is meant to be used, which is to say people’s homes, with their own webcams, lighting and chairs, and asked whether it could pick up differences in how people respond to content typically tested in neuromarketing.
The remote data collection process
Participants were recruited through Prolific, all native English speakers. 205 completed the study (52% female, mean age 24.3), with completion meaning they watched every stimulus and their webcam video was captured and stored.
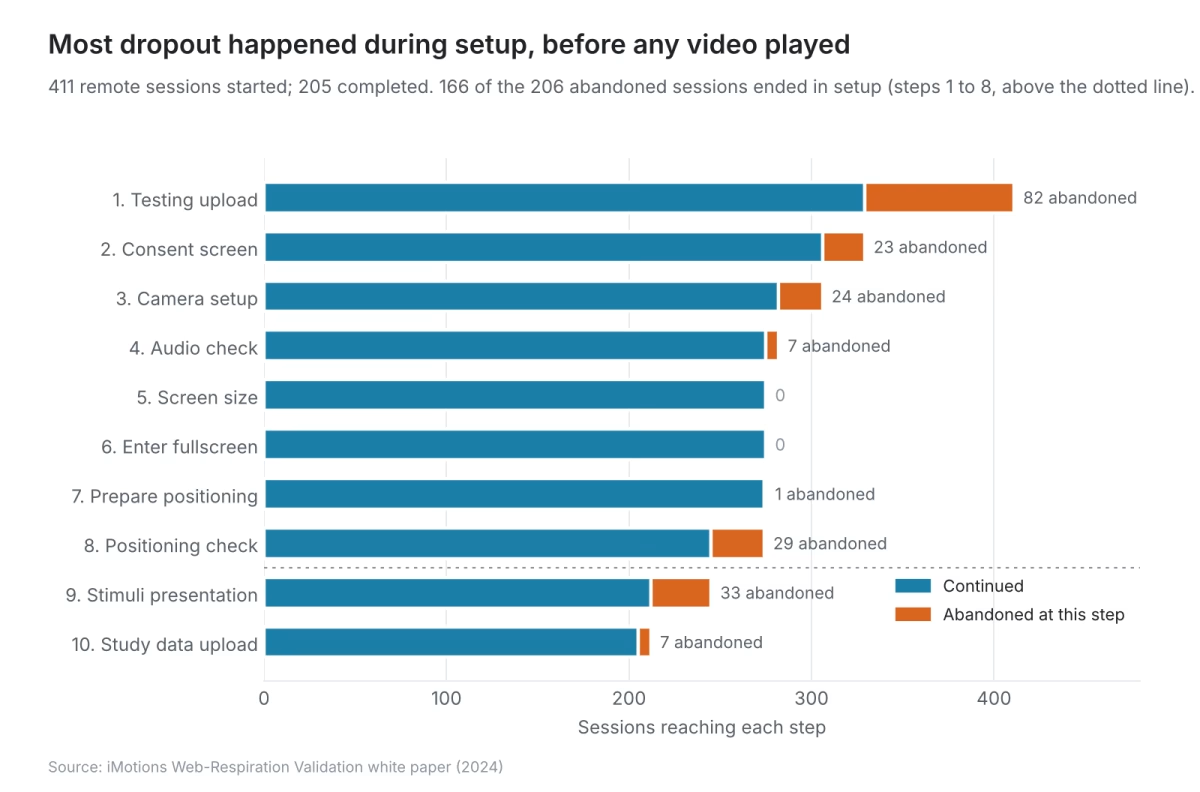
In the interest of honesty about remote research, another 206 sessions were abandoned at some point between setup and the final upload. That roughly one-to-one ratio is worth planning for if you are budgeting a webcam study, and the reassuring part is where it happens: 166 of the 206 abandoned sessions ended during setup, before a single second of content had played.
Each participant gave informed consent to being recorded, then watched five videos in a session of about 15 minutes: a neutral baseline, two humorous ads (one for Tide, one for Alexa), and two image sequences from the International Affective Picture System, one positive and one disgusting (Lang, Bradley, & Cuthbert, 2005).
Question 1: What does data quality look like in the wild?
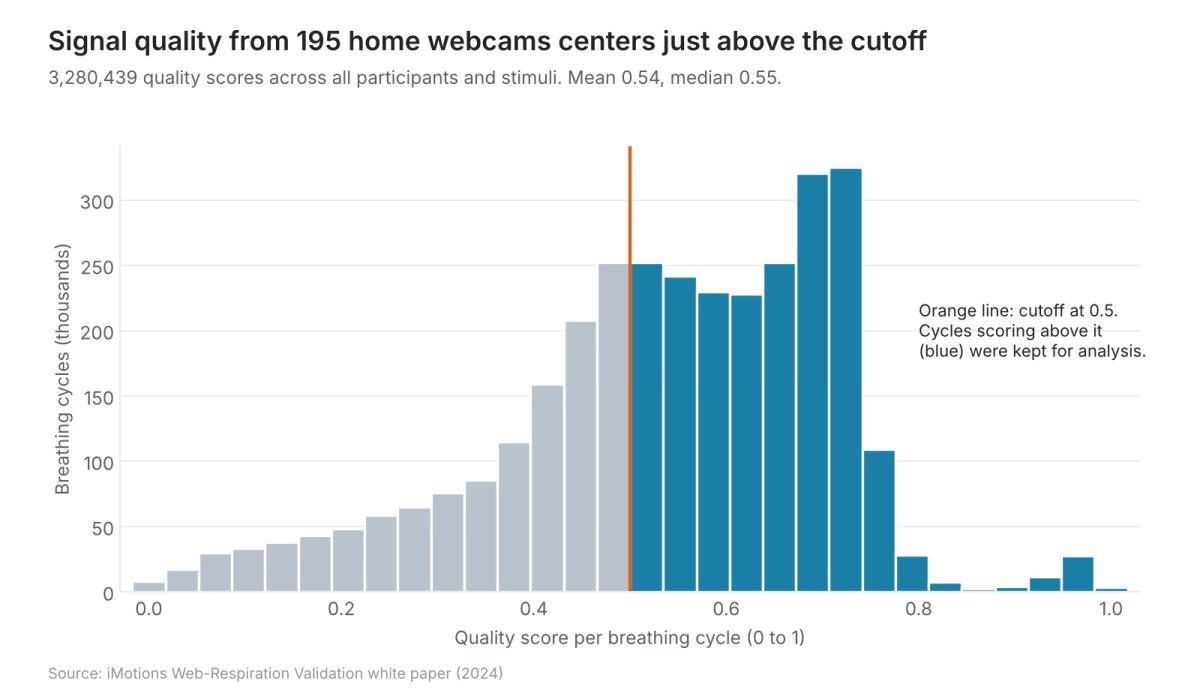
Across 195 participants, the algorithm produced 3,280,439 quality scores, one per preliminary breathing cycle. The mean was 0.54 and the median 0.55, on a scale from 0 to 1.
We set 0.5 as the cutoff for usable data, and also excluded any stimulus where a participant had fewer than 10 breathing cycles. That leaves a fair share of data on the cutting-room floor, which is the price of measuring something as subtle as chest movement through a laptop camera, and the reason the quality score exists in the first place.
Question 2: Does breathing change with the content?
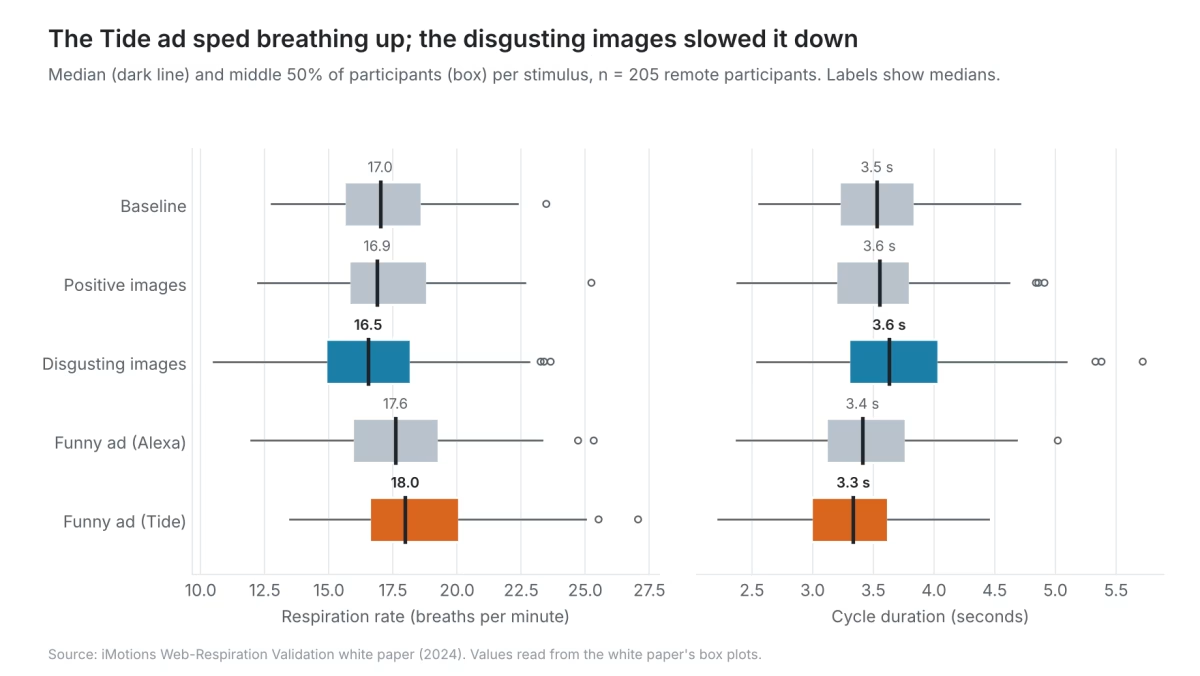
It does. Differences between conditions were tested with an ANOVA followed by Tukey’s post-hoc test.
The Tide ad produced a significantly higher respiration rate than the baseline video (p < .01), the disgusting images (p < .001) and the positive images (p < .01). The Alexa ad also had a significantly higher respiration rate than the disgusting images. Few people expect a laundry detergent commercial to quicken their breathing, but here we are.
Cycle duration told the mirror-image story. Breathing cycles during the disgusting images differed significantly from both funny ads (p < .001) and from the baseline (p = .05), with people taking slower, longer breaths, consistent with their lower respiration rate. The Tide ad also differed significantly from the positive images (p < .05).
What the results suggest
The pattern lines up with earlier lab research. Amusement tends to shorten inhalation, which shortens the whole cycle and speeds breathing up, while disgust tends to extend inhalation and slow things down, sometimes to the point of holding one’s breath altogether (Boiten, 1998; Jerath & Beveridge, 2020).
Taken together, the results suggest breathing measured by webcam can index arousal, how activated someone is, and to some degree valence, whether the experience is pleasant or unpleasant. The two funny ads did not behave identically either, which is precisely why content gets tested instead of assumed to work.
Recommendations: getting good data from webcam respiration
A webcam is not a belt, and pretending otherwise helps nobody. Version 1.0 of the algorithm was optimized for estimating breathing cycles, so it gives you respiration rate, cycle count and cycle duration. It is not yet tuned to time inhalation and exhalation separately, and both studies measured spontaneous breathing only, not paced or controlled breathing exercises.
Most of what can go wrong comes down to the camera’s view of the chest. A few practical things help:
- Ask participants to keep their arms and hands still, since upper-body movement adds a lot of noise to the signal.
- Make sure the chest and shoulders stay in view. Folded arms, or arms resting on the chest, block what the algorithm needs to see.
- Mind the contrast between clothing and background. A grey sweater against a grey wall is hard for any camera to track.
- Expect laughter to cost you data. It brings irregular, forceful breathing and a lot of movement, which is mildly inconvenient when your stimulus is a funny ad.
None of these are unusual demands. They are the webcam equivalent of asking people to sit up straight and not wave their arms about, and the quality score tells you afterwards which segments to keep.
Conclusion
The white paper set out to answer two questions. Does the iMotions webcam respiration algorithm agree with a gold-standard respiration belt? In a controlled lab, yes: strong correlations, an average error below one breath per minute, and no drift at higher breathing rates. Can it pick up meaningful differences in how people respond to content, remotely and at scale? Across 205 participants watching ads and affective images at home, also yes.
The point is less the novelty of measuring breathing through a laptop than what it removes. Respiration has long been a lab-only measure, partly because nobody wants to post a chest strap to 200 strangers. A webcam they already own takes that problem off the table, which opens the door to respiration data in communications research, psychology, education and consumer neuroscience studies that were never going to fit in a lab.
The full methodology, statistics and plots are in the white paper. Download it here, or book a demo to see webcam respiration in iMotions.
References
Boiten, F. A. (1998). The effects of emotional behaviour on components of the respiratory cycle. Biological Psychology, 49(1-2), 29-51. https://doi.org/10.1016/s0301-0511(98)00025-8
Jerath, R., & Beveridge, C. (2020). Respiratory rhythm, autonomic modulation, and the spectrum of emotions: The future of emotion recognition and modulation. Frontiers in Psychology, 11, 1980. https://doi.org/10.3389/fpsyg.2020.01980
Lang, P. J., Bradley, M. M., & Cuthbert, B. N. (2005). International Affective Picture System (IAPS) [Database record]. APA PsycTests. https://doi.org/10.1037/t66667-000
Seernani, D., Gregoret, L., Korepanov, A., Wilson, J., & Jensen, O. (2024). iMotions web-respiration validation [White paper]. iMotions A/S.
Shea, S. A. (1996). Behavioural and arousal-related influences on breathing in humans. Experimental Physiology, 81, 1-26.