The first descriptions of autism can be found as far back as the late 1800s, but it took until 1938 before the word was used in a context that we would recognize today. Hans Asperger (from whom the term “Asperger’s syndrome” comes from), was the first to outline details of the disorder, and it still took another forty years before any widespread clarity for diagnosis was achieved.
As with many things – progress is slow at first, and then very quick. We are now at the stage where the pace of understanding is quickening. We are proud to be able to say that iMotions has been a part of helping researchers advance the knowledge and understanding of Autism Spectrum Disorder (ASD).
A great example of that is shown with the Janssen Autism Knowledge Engine (JAKE) project, which uses iMotions at its center, and has led to five new articles in the last twelve months alone. Below, we will walk you through some of these findings, showing you new discoveries in autism research, and the tools used to make the research happen.
Background
ASD is a multifaceted neurodevelopmental disorder – it usually consists of impaired social and communication skills, and constrained or repetitive behaviors. It affects, according to recent estimates, as many as 1 in 54 people [1], and is wide-ranging in severity across individuals.
Despite the impact it can place upon individuals and families, therapy (such as Applied Behavior Analysis) remains the only approach that can positively affect people with ASD. One of the core goals of autism research is to better understand the disorder, by following treatment more closely, and examining the prevalence of ASD subtypes.
Recent Research
Researchers from Janssen Research and Development (owned by Johnson and Johnson), have over the recent years combined forces with scientists from over 30 other universities, institutes, and organizations to examine the development of autism using combined biosensors with iMotions.

The foundation of this research is JAKE (Janssen Autism Knowledge Engine) – a set of measurements designed to facilitate further understanding of autism [2]. This study in particular set out to validate the system to help advance knowledge in the future – to assess the feasibility of collecting such a complex set of data.
This proof-of-concept study followed 29 ASD children, and 6 typically developing children (both with an average age of 10), using data from a variety of biosensors, and also from sources such as caregiver journals, medical histories, and activity levels, among others. All of this provided a comprehensive and far-reaching view of the individual’s experience.
The JAKE biosensor array consisted of:
- Eye tracking
- EEG
- Facial expression analysis
- ECG
- Galvanic skin response
The researchers were then able to objectively follow the participants both continuously (gathering information on a daily basis), and periodically (at discrete intervals).
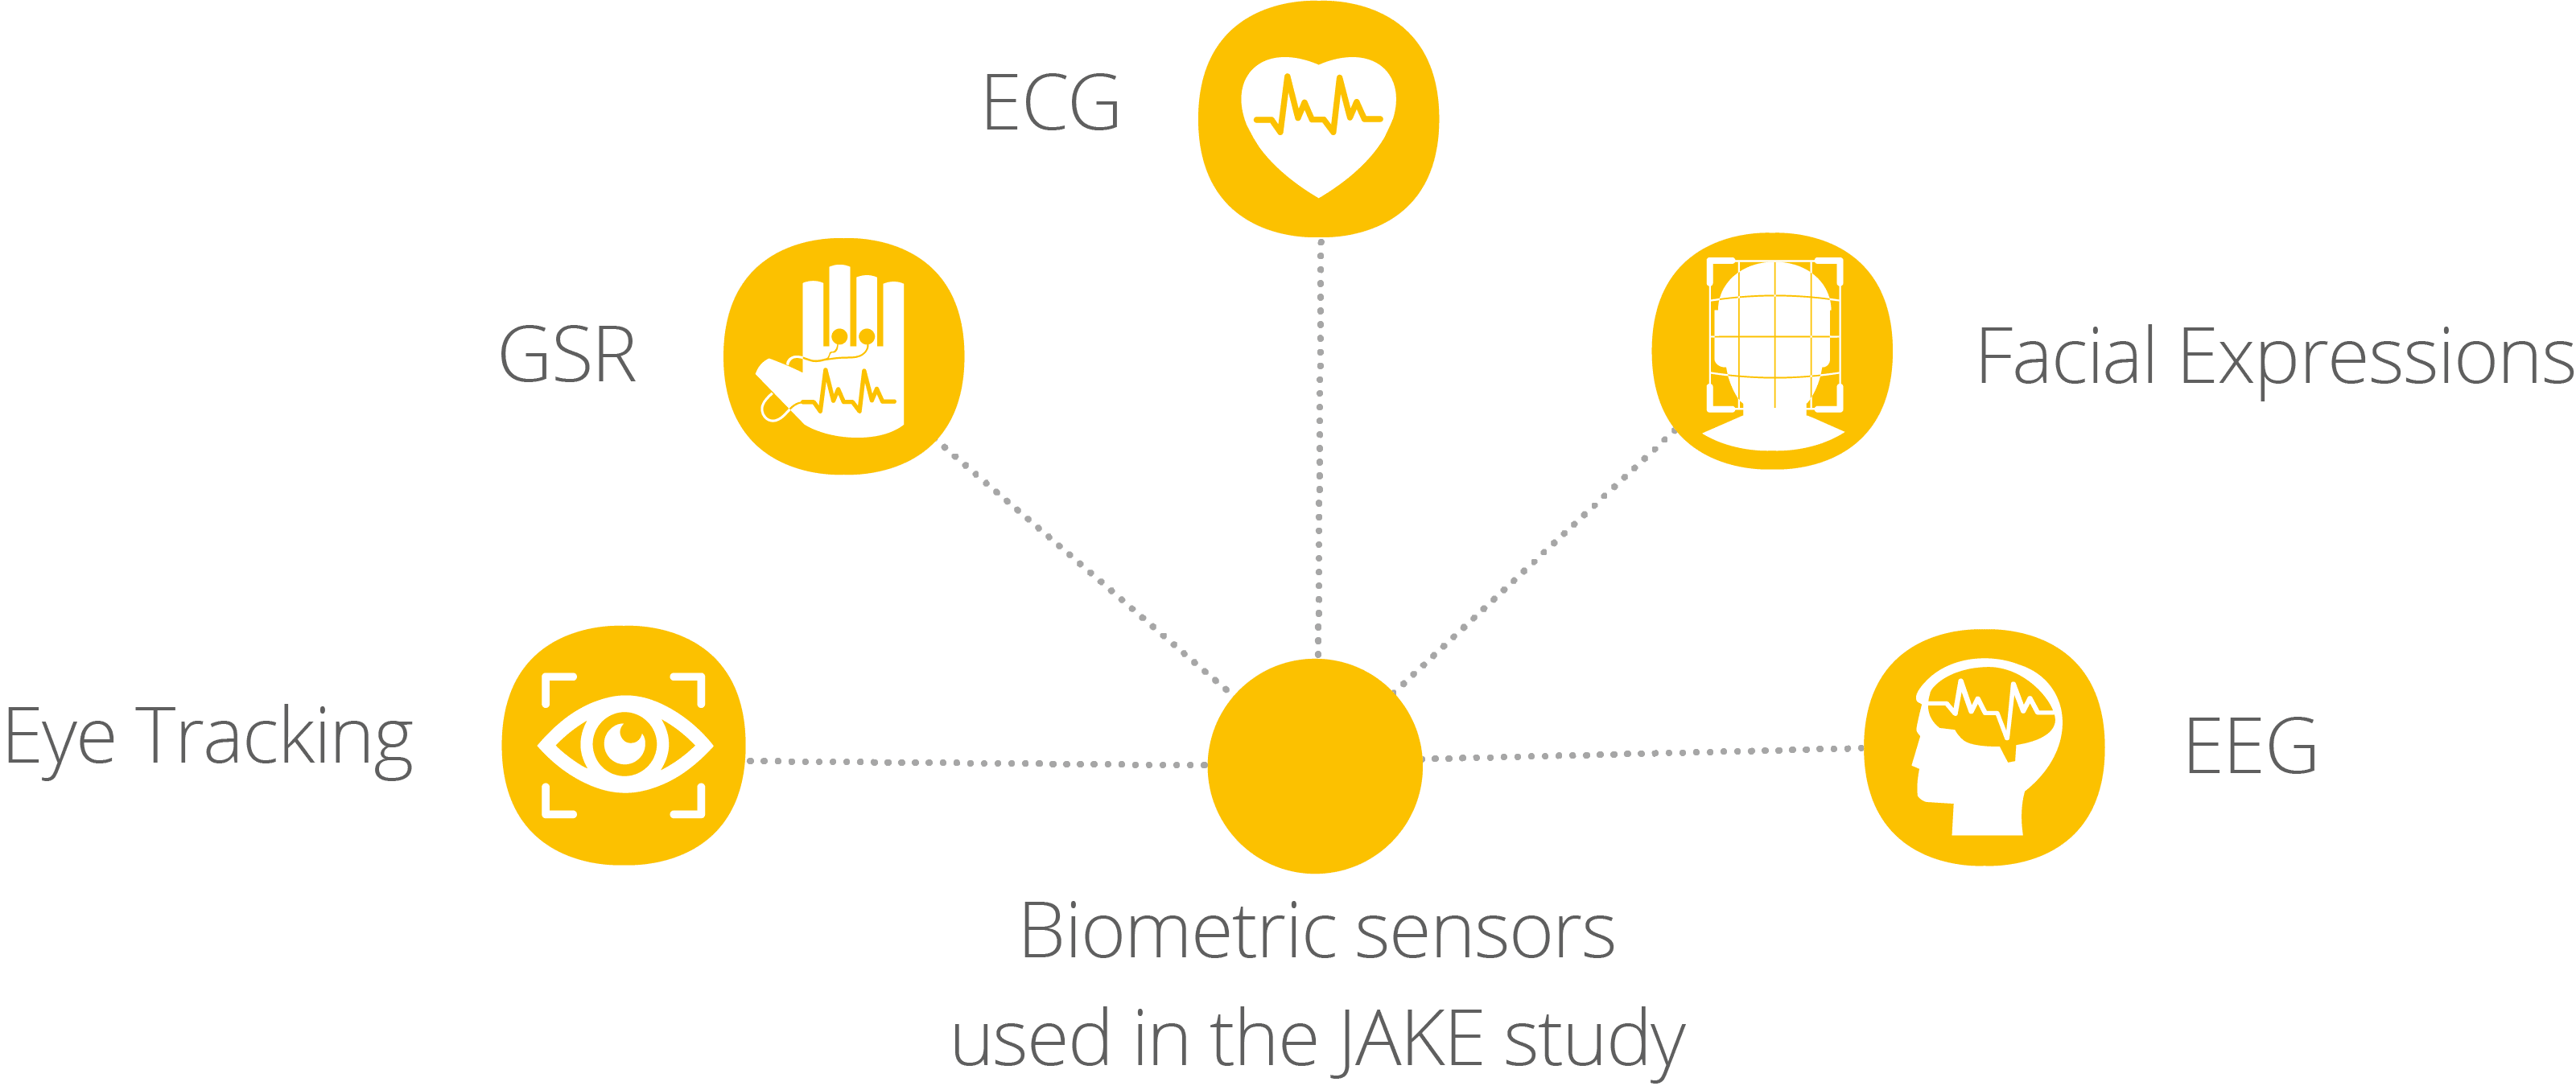
With the help of caregivers, crucial information about the participant’s well-being could be recorded throughout the research period. Discrete tasks were also administered at periodic intervals, which were centered around a specific biosensor modality, which are detailed below. Cognitive function was also assessed through the Cogstate Computerized Test Battery, designed to measure ASD-associated cognitive deficits.
Through the use of multiple data streams, the researchers hope to develop biomarkers (objective biological measurements that are associated with a disorder) that can help detect subtypes of ASD, and also provide objective measurements of how therapeutic treatments can impact individuals.
We’ll go through how each of these biosensors have been used in JAKE, and some of the recent research that has taken this framework further.
Eye tracking
The JAKE platform has been established to initially examine responses to four different visual scenes:
- 1. The first video features either a woman showing eye-contact and child-directed speech, or non-social cues (toys). The aim is to see where the child focuses their attention, as previous research has shown that eye-contact and child-directed speech is more likely to keep the attention of typically developing children than ASD children.
- 2. The VET task features a wide variety of images, with various types of content, displayed at the same time – the children are free to look at the scene, and the researchers are able to determine where their preferences lie. Some of the images were previously shown to be of high or low interest to people with ASD, so the amount and type of visual preference can be determined.
- 3. The Biological Motion Preference task shows a series of dots that either look like a human walking, or move in a random left-right fashion.
- 4. The Activity Monitoring task shows acted out scenes, with distracting visual cues in the background. For both of these tasks, ASD children are more likely to pay attention to the non-biological, and visual cues in the background.
Each of these tasks provides a thorough examination of the preferences shown by ASD children. The data can be examined for minor differences, and can inform theories about possible subtypes of autism, and the subtle changes that may occur in response to therapeutic treatments. One of the recently published articles shows how.
While it has long been known that autistic children are less attuned to the social aspects of a visual scene when compared to neurotypical children, it is less established whether or not such a feature persists into adulthood.
Using elements of the JAKE platform, researchers examined visual attention using eye tracking in both young and adult autistic individuals, and those classed as typically developing [3]. They found that while differences remained when comparing autistic individuals vs those without autism, the adults in both groups were more likely to look at the social aspects of the scene, regardless of age.

This suggests that an increased focus to social aspects of a visual scene increases with age, regardless of an autism diagnosis (although the reasons for why this might remain unclear). This means that while eye tracking might not be able to guide diagnosis of autism in adults, it could still be useful as an additional piece of data for children.
EEG
EEG has been used in a similar manner to the eye tracking tasks, focussing on the four central visual tasks. As before, each task was performed to allow the researchers to examine potential differences between autistic and typically developing individuals, but in this instance with brain activity (power spectra, asymmetries, and event-related potentials were all collected – explanations of which are a bit beyond the scope of this blog post, but in essence reflect the level of activity in different brain regions, at different times).
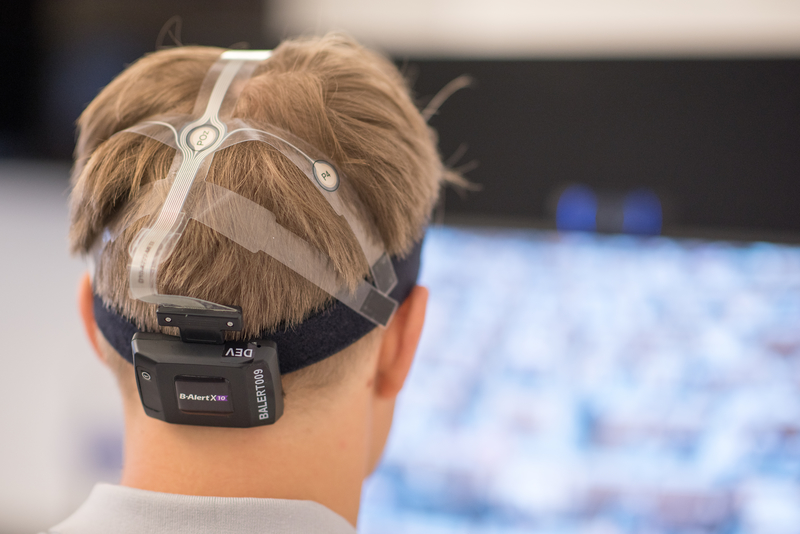
The investigation can then focus on how, when, and where brain activity is increased or decreased in general, and in response to social stimuli. As EEG has such a high temporal resolution (i.e. can collect many datapoints in a short amount of time), it provides a sensitive measure for analysis.
ECG
ECG was used to derive a range of measures that pertain to heart rate variability. Combined with other sensors, the ECG recordings could therefore provide information about the level of physiological arousal that the participants were experiencing while completing the tasks above, or other tasks within the study.
Increased heart rate variability has been found to be associated with increased social cognition – typical performance in social environment, suggesting that ASD participants may have a lower heart rate variability than typically developing children.
GSR
Due to the portability (and relatively low power consumption) of the GSR device, it was possible to collect GSR data continuously, both within the tasks and in everyday life.
The GSR device provides a great method of examining the physiological arousal of the participants, through recordings of both tonic and phasic GSR activity.
Research has shown that GSR responses of ASD children is not necessarily changed in response to a social stimuli (e.g. a face), which is usually the case with typically developing children. This suggests that GSR changes wouldn’t be expected in the ASD children within this study.
Facial Expression Analysis
Facial expression analysis was also carried out as part of the JAKE platform research, primarily focussing on analyzing the emotional responses to “a set of videos chosen for their humorous visual content” [2].
One of the recent articles that was published from the study utilized this experimental paradigm, using videos from the TV program “America’s Funniest Home Videos”. The researchers assessed smiling responses in both autistic and typically developing individuals using automatic facial expression analysis.
They found that overall, autistic individuals were less likely to engage smiling muscles in response to funny videos than control participants, but digging deeper, they found that two distinct subgroups emerged – one of which smiled more than controls, and the other which smiled less. It’s important to note that the research does not of course suggest that the autistic participants experienced emotions any less than the other participants, but just that their facial expressions differed.
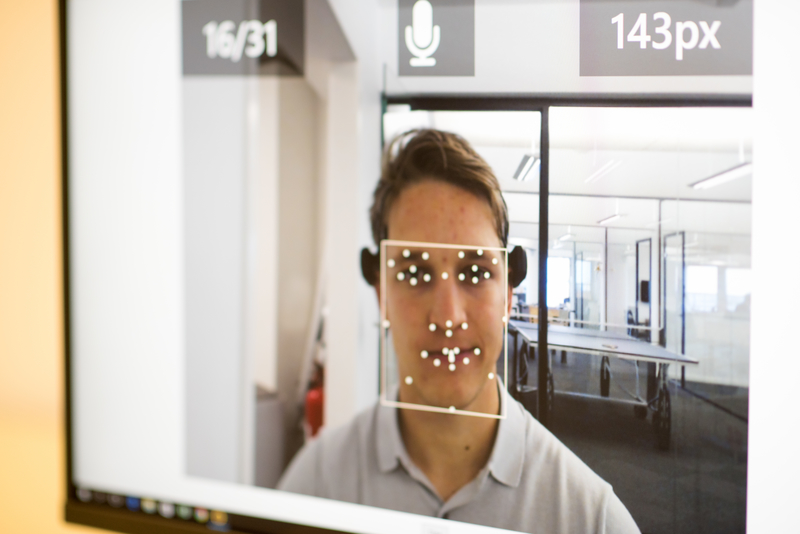
Future research may investigate the differences between these subgroups in more detail, but this finding may hold a key to understanding different outward displays of emotions in autistic individuals.
Conclusion
The authors expect that the research will be able to continue to provide information about biomarkers for ASD, and that ongoing measurements can use these biomarkers to objectively provide information about treatment outcomes.
While the work is far from over, it could well be the beginning of smart, personalized treatment for those who need it with ASD, helping improve deficits where they exist.
I hope you’ve enjoyed reading about this innovative new research being carried out with the help of iMotions. To have a look at more groundbreaking research, look through our publication list, or reach out to us to hear about how iMotions is helping researchers worldwide, in universities and companies, to solve some of the biggest questions in human behavior research.
If you’d like to learn more about one of the principal methods in this article – eye tracking – and how it can specifically provide objective information about human behavior, download our free (and recently updated) guide below.
Eye Tracking
The Complete Pocket Guide
- 32 pages of comprehensive eye tracking material
- Valuable eye tracking research insights (with examples)
- Learn how to take your research to the next level

References
[1] Baio, J., Wiggins, L., Christensen, D. L., Maenner, M. J., Daniels, J., Warren, Z., Kurzius-Spencer, M., Zahorodny, W., Robinson Rosenberg, C., White, T., Durkin, M. S., Imm, P., Nikolaou, L., Yeargin-Allsopp, M., Lee, L. C., Harrington, R., Lopez, M., Fitzgerald, R. T., Hewitt, A., Pettygrove, S., … Dowling, N. F. (2018). Prevalence of Autism Spectrum Disorder Among Children Aged 8 Years – Autism and Developmental Disabilities Monitoring Network, 11 Sites, United States, 2014. Morbidity and mortality weekly report. Surveillance summaries (Washington, D.C. : 2002), 67(6), 1–23. https://doi.org/10.15585/mmwr.ss6706a1
[2] Ness, S. L., Bangerter, A., Manyakov, N. V., Lewin, D., Boice, M., Skalkin, A., Jagannatha, S., Chatterjee, M., Dawson, G., Goodwin, M. S., Hendren, R., Leventhal, B., Shic, F., Frazier, J. A., Janvier, Y., King, B. H., Miller, J. S., Smith, C. J., Tobe, R. H., & Pandina, G. (2019). An Observational Study With the Janssen Autism Knowledge Engine (JAKE®) in Individuals With Autism Spectrum Disorder. Frontiers in neuroscience, 13, 111. https://doi.org/10.3389/fnins.2019.00111
[3] Kaliukhovich, D. A., Manyakov, N. V., Bangerter, A., Ness, S., Skalkin, A., Goodwin, M. S., Dawson, G., Hendren, R. L., Leventhal, B., Hudac, C. M., Bradshaw, J., Shic, F., & Pandina, G. (2020). Social attention to activities in children and adults with autism spectrum disorder: effects of context and age. Molecular autism, 11(1), 79. https://doi.org/10.1186/s13229-020-00388-5


