Introducing the new Areas of Interest (AOI) Editor in iMotions 9.0 marks a significant product release. This feature enhances user capabilities, providing a streamlined experience for defining and analyzing areas of interest in research data. Researchers will benefit from improved tools for precise data interpretation and analysis, elevating research possibilities in iMotions 9.0.
Table of Contents
If you’ve ever worked with eye tracking, you know that a high-quality eye tracker is one important part of the data equation to gather precise and accurate data; but eye tracking studies are not complete without analysis of that data. Because what good is eye tracking data without being able to draw conclusions from it?
As an eye tracking researcher, you will also know that defining Areas of Interest (AOIs) can be a very laborious task, especially if you recorded eye tracking data on videos or collected data with eye tracking glasses. High-performance software like iMotions can help answer your research questions faster and easier.
Helping researchers assess visual attention with eye tracking has been a cornerstone of the iMotions software since its infancy. We’ve listened closely to our customers as you’ve asked for better tools to define and analyze the eye tracking metrics related to the specific objects you’re most interested in for the data you’ve collected.
Therefore, we are pleased to announce that in iMotions 9.0, we have completely revamped our Areas of Interest (AOI) Editor to help make your eye tracking analyses more accurate, flexible, and quicker. Below, we detail some of the coolest new features in this release.
Save time with the revamped UI and intuitive workflows
An Area of Interest is a tool to select regions of a displayed stimulus, and to extract metrics specifically for those regions. While not strictly a metric by itself, it defines the area by which other metrics are calculated. These metrics come in handy when evaluating the performance of two or more regions in the same video, picture, website, or program interface.
Learn more about AOIs here.
With the new AOI Editor, we have improved the user interface and unified the workflows with convenience and ease of use in mind. We’ve focused on flexibility and intuition so that you have more control over how you define and analyze your areas of interest.
We’ve made it simpler and quicker to draw, interpolate and copy AOIs, and create templates so that you can re-use your AOIs across different studies. We’ve also focused on how you can visualize, present and export relevant metrics. These improvements ease the time investment associated with performing data analysis with areas of interest.
1) Define and Edit AOIs
One of the most exciting updates with this release is in how you draw Areas of Interest. No matter whether you are working with images, surveys, video stimuli, or recordings, you can now draw rectangular, elliptical, or polygonal AOIs, all in the same workflow no matter what stimulus or eye tracker type you collected data from.
Even complex shapes can be tracked with a fitting AOI, allowing you to define polygons around your objects. You can move, resize, reshape, and rotate AOIs by dragging them with the mouse or entering precise numerical values. Grouping AOIs together allows you to more easily manage your AOIs and summarize your metrics in the statistical analysis.
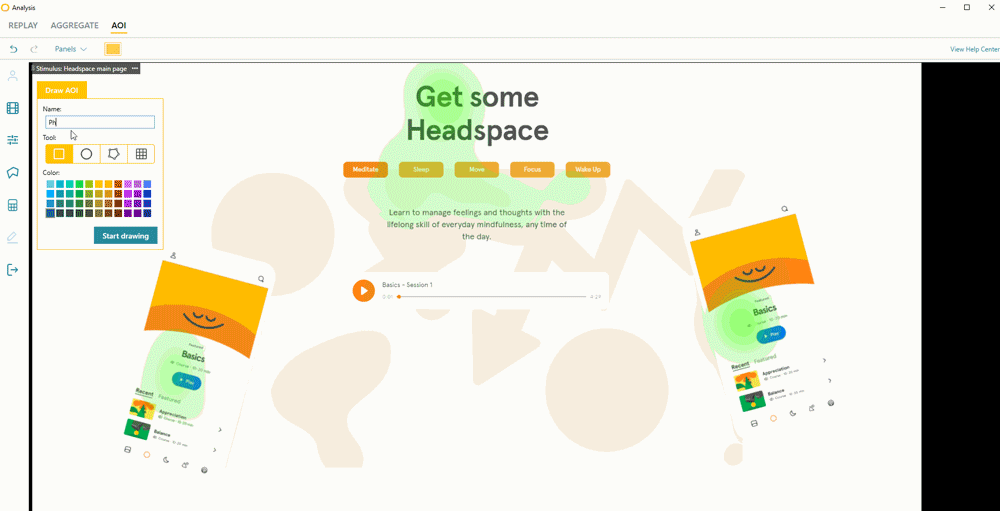
Setting, adjusting and copying AOIs around your objects takes only a few clicks.
We have worked hard to improve the moving AOIs capabilities, so manipulating them is more intuitive. Turning AOIs off and on is easier and more precise than ever before. Associating your AOIs with hot keys on your keyboard means you can efficiently turn your AOIs off and on as the objects that you want to track disappear and reappear while replaying your data, even for multiple AOIs in parallel.
Applying interpolation allows you to shortcut manual adjustments of your AOI when objects are moving. Say, for example, your branding study includes animations of the product as the camera zooms in on the object. With interpolation, you just set one key frame at the start of the shot and one key frame at the end of the shot, and iMotions will then do all the work for you in between, and reshape the AOI as your product grows in size.
As a default, the AOI will always remain in its current state (i.e. at its current location with the current size) until you edit it. However, using linear interpolation makes the AOI move from one location to the other without you having to manually adjust it on every frame in between.
Interpolation takes the manual work out of following your AOIs as they move across the screen.
For researchers who want to save a bunch of time on big studies, you can now also make AOI templates, or import AOIs as templates from those previously made, with the touch of a button. It’s simple to choose which AOIs you want to make into a template, or create a template from an existing AOI. For example, say you are a market research agency and you are performing an image ad study for a particular brand, you could define the brand logo as an AOI template to use with each respondent instead of redrawing it every time you have a design with a similar layout!
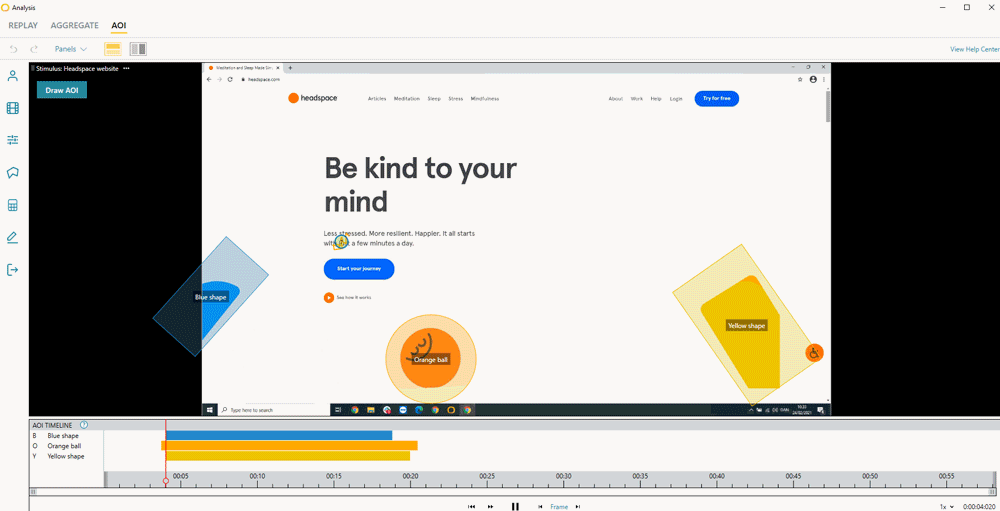
We have also introduced a new AOI type: Gridded AOIs. This feature allows for an objective quantification of scanpath patterns beyond the semantics of the actual stimulus, allowing you to study how your respondents scanned the overall stimulus rather than assessing their visual interaction with specific parts of the stimulus. They also help you reveal whether your respondents engaged with the entire stimulus or just stared at one location. Setting an AOI grid is as easy as defining how many rows and columns you want to place!
Gridded AOIs are great for quantifying scanpaths and assessing visual attention on an overall stimulus.
And say you make a mistake — or want to prevent making one — make use of the handy undo, hide, and lock functions. Integrated help texts will also guide you through the most important tasks.
2) Flexible Metrics
The release of iMotions 8.0 in 2019 brought forward a whole new way of thinking about signal processing across all the modalities iMotions supports. With the ambition to take signal processing out of the black box, we carried all our algorithms over to R Notebooks so that you as a researcher have the full transparency of how iMotions filters and quantifies the raw data.
With this iMotions 9.0 release, eye tracking metrics are also now completely supported by R Notebooks, and all signal processing code can be accessed and read by the analyst. This means that if you aim to publish the results that you obtained from a study analyzed in iMotions, you can review all relevant code snippets and extract the information that is relevant to state in your paper.
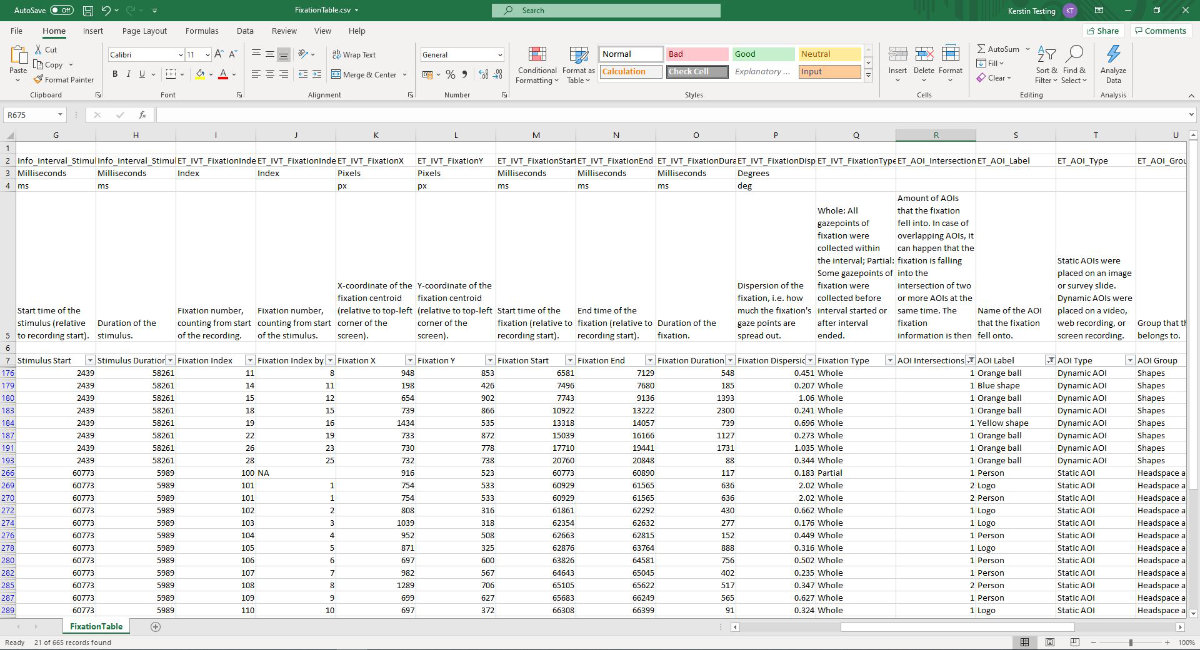
Of course, all metrics that iMotions computes from your eye tracking data and AOIs can be exported into a handy .csv table, so that you can focus on statistical analysis. You can retrieve a multitude of AOI metrics such as dwell time, time to first fixation, revisits, and how many respondents actually looked at your AOI. Additionally from iMotions 9.0 and onwards, you are also able to retrieve statistics about saccades.
Here is a list of available metrics:
| Information | Gaze based AOI metrics | Fixation based AOI metrics | Saccade based AOI metrics | Mouse based metrics |
| Stimulus duration | Respondent count | Respondent count | Respondent count | Respondent count |
| AOI duration | Respondent ratio (%) | Respondent ratio (%) | Respondent ratio (%) | Respondent ratio (%) |
| Size (px2) | Dwell count | Dwells with fixations | Dwells with saccades | Mouse click count |
| Size (cm2) | Revisit count | Revisit count | Saccade count | |
| Size (%) | Hit time AOI (ms) | Fixation count | Entry saccade onset AOI (ms) | |
| Valid data | Hit time parent (ms) | TTFF AOI (ms) | Entry saccade onset parent (ms) | |
| Respondent base | Dwell time (ms) | TTFF parent (ms) | Saccade duration (ms) | |
| Dwell time (%) | TTFF max. (ms) | Amplitude (deg) | ||
| First dwell duration (ms) | Dwell time (ms) | Peak velocity (deg/s) | ||
| Last dwell duration (ms) | Dwell time (%) | Peak acceleration (deg/s2) | ||
| Skip count | Fixation duration (ms) | Peak deceleration (deg/s2) | ||
| First fixation duration (ms) | Direction (deg) | |||
| Last fixation duration (ms) | ||||
| Dispersion (deg) |
A popular feature of iMotions has always been the ability to review AOI metrics already inside the software, without the need to export the data. We have sunsetted the “sticky notes” and are offering you better access to your metrics for all your stimuli. All metrics are directly visible in the UI for a quick overview of your results, and rather than showing all results immediately you can now choose to review your metrics first after you are done with defining all AOIs. If you would like to share your insights with colleagues or clients, you can generate image or video exports of your data alongside the AOI metrics.
It’s up to you which metrics you want to display. You can pick and choose the metrics that matter most to you, and if you ever should come across a metric that is new to you, the new help icon will display the definition of it.
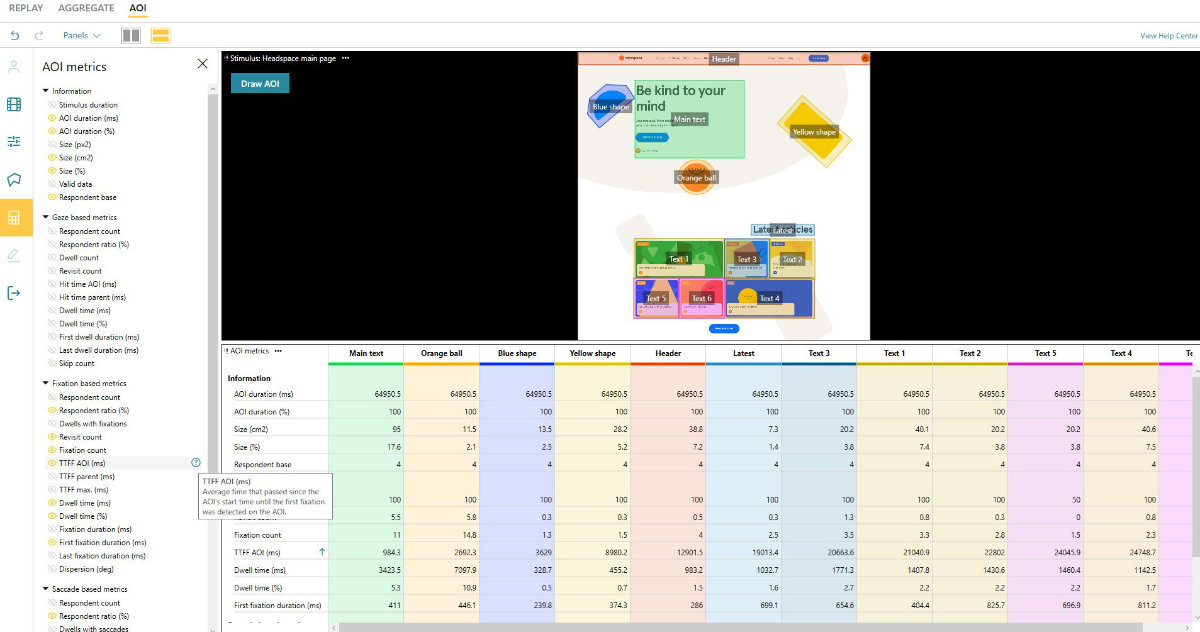
Hovering over a metric in the list shows its definition, so you can choose whether to display it in the metrics table.
3) Visualizations and Annotations
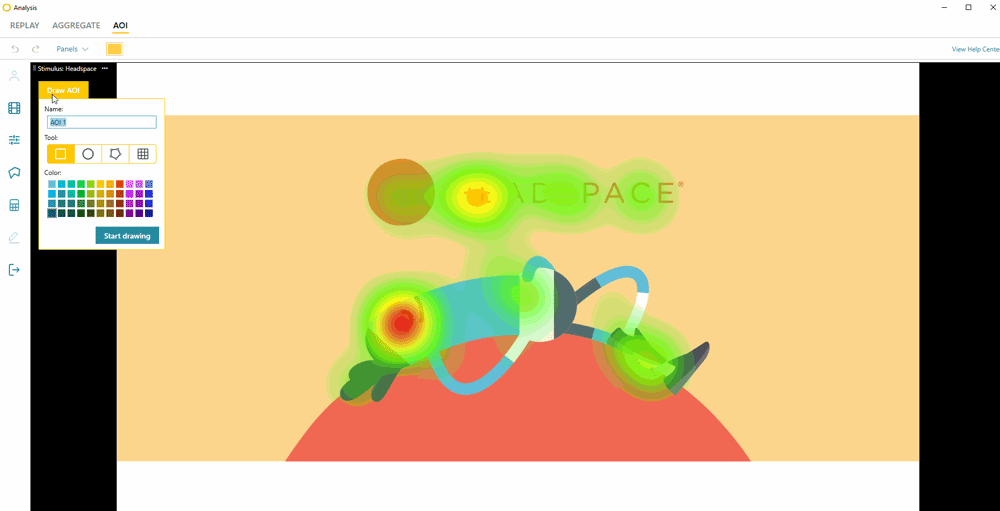
Typically, AOIs are set objectively and based on the hypothesis that you have about the objects in your stimulus. But we know that researchers also like to take a first look at gaze visualizations such as heat maps or gaze paths, and then proceed to quantify these with AOIs. Therefore, we’ve made it possible to create visualizations with heat maps and gaze plots, and then layer on AOIs simultaneously, all with the goal of helping you systematically make sense of and present your data in line with your study process.
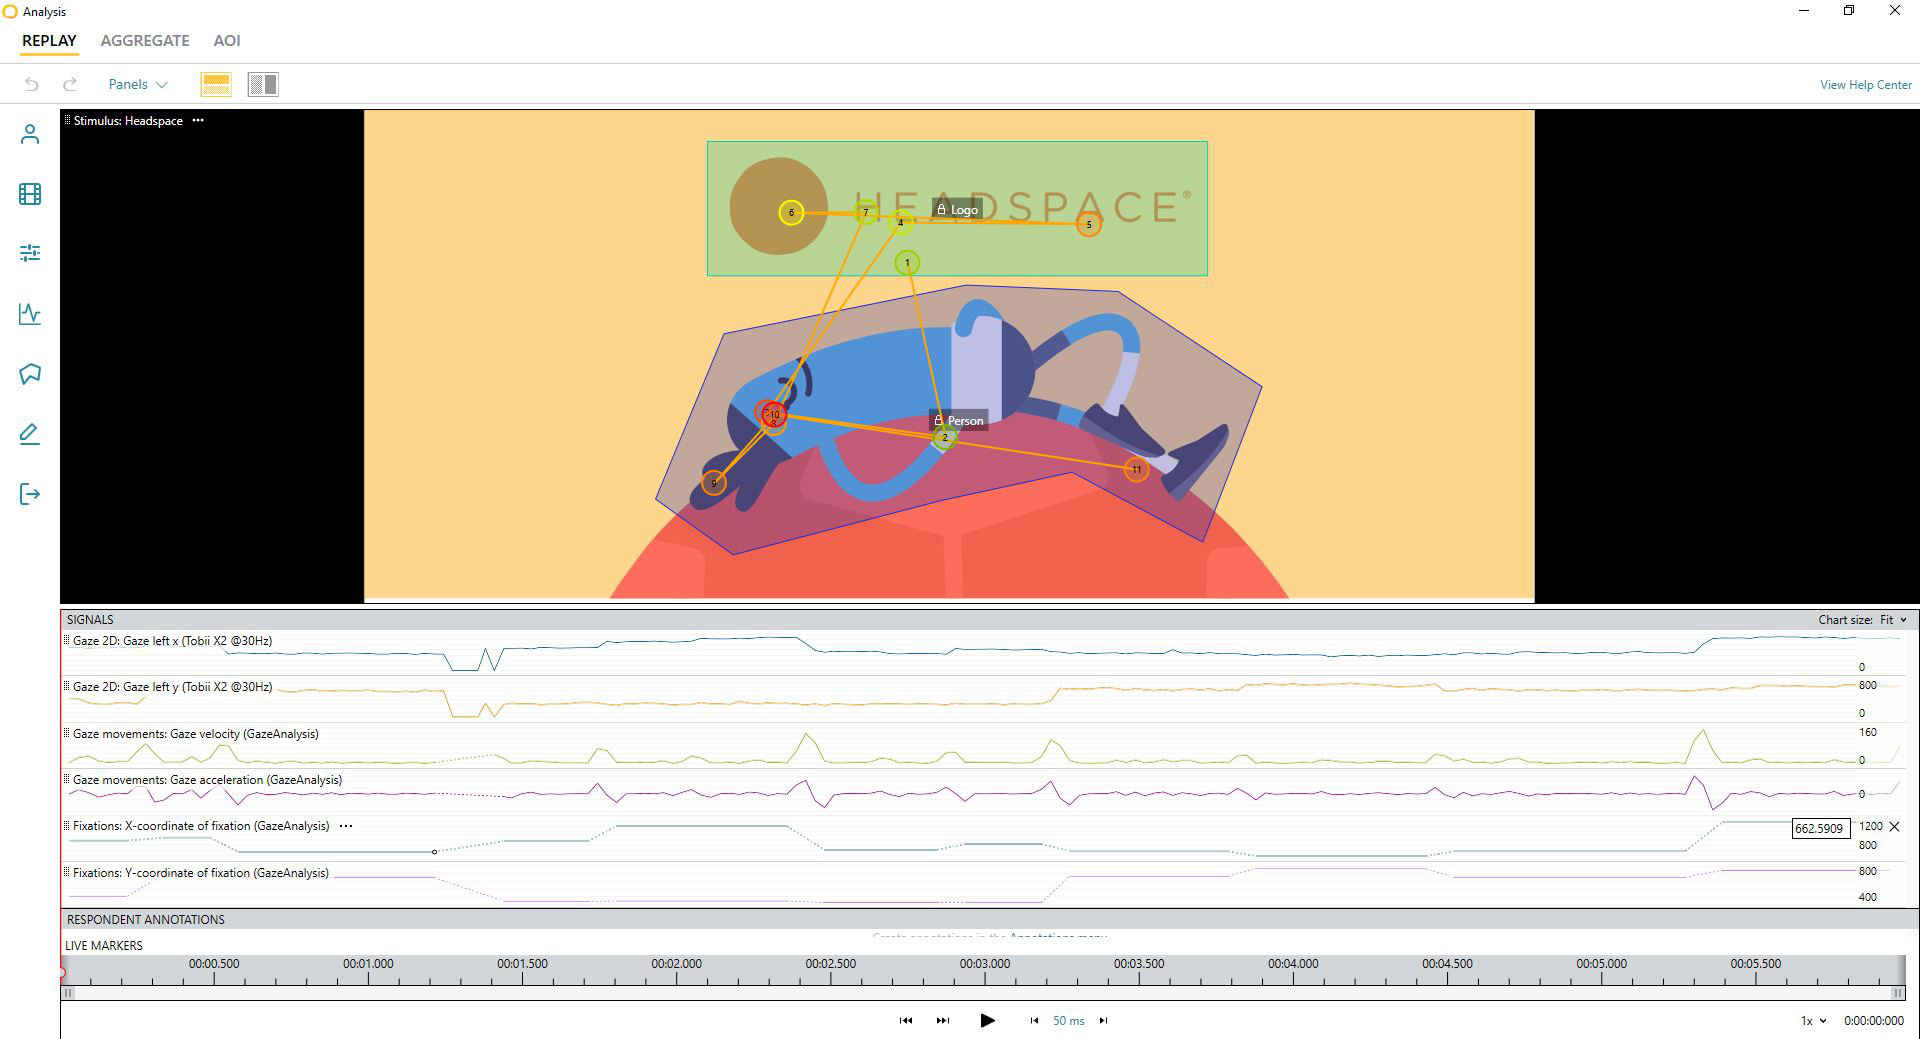
Layer on gaze plots, heat maps, annotations and live markers, etc with AOIs simultaneously.
We know that annotations are equally important for analyzing behavioral data, so with this new AOI Editor, the annotations that you are defining are synced across all editors, whether you are in the AOI Editor, the aggregate editor or individual recordings. It is easy to set your annotations because iMotions allows you to precisely step through your recordings, and you can even utilize live markers to find the most relevant parts of your recording. For example, if you have live markers every time your respondents put an item into the shopping cart, it is easy to directly jump to this task in the recordings, and define AOIs accordingly.
4) Simplified Exports
iMotions is all about helping you better convey your study findings to your peers, publish to your scientific community, or communicate to your customers. In conjunction, we recognize that exporting data in easy-to-use formats is paramount for the data analysis phase of your research. You can choose to export your AOI summary metrics by individual respondents or already aggregated and averaged for the entire segment. To avoid central bias, you can choose to exclude fixations from the beginning of the stimulus presentation from your exported data. Descriptions and unit information included in the export make it easier to understand all the metrics that you have exported.
In addition to summary metrics per AOI, you can also export fixation and saccade tables with detailed statistics about your oculomotor events and the order in which the respondents dwelled at the AOIs that you defined, allowing you to easily proceed with scanpath analyses and other statistical comparisons.
Ready to get started?
Whether you are an eye tracking pro or just getting your feet wet, we hope that the new Areas of Interest (AOI) Editor in iMotions 9.0 will alleviate the biggest pain points in performing eye tracking analyses, saving you time and allowing you the flexibility to execute the eye tracking studies in a way that is completely catered to your research needs.
Want to see the new AOI Editor for yourself? Request a live, personalized demo with a Product Specialist! Current iMotions clients can also head to the iMotions Help Center to download iMotions 9.0 directly.
Contributing Writers
Anna MacMurdo, Senior UX Designer
Jonas Lund, Senior Software Developer
Amandine Grappe, Data Scientist
About iMotions
iMotions was founded in 2005 with the vision of becoming the leading eye tracking and emotion recognition engine on the market. 16 years later, we haven’t left our eye tracking roots as we continue to expand our suite of multimodal sensors and data synchronizations – in 2020 alone, we provided compatibility for 6 new eye trackers from our hardware partners. The new AOI Editor helps you better complete your analysis of data collected from all the eye trackers compatible with iMotions, and you can also combine data from other modalities like facial expression analysis, galvanic skin response, heart rate, and EEG.