
Online or Remote Research usually consists of distributing surveys online. With tools like iMotions Remote Data Collection (RDC), you can have the flexibility of remote research combined with the insights of a lab using only your participants’ web camera and microphone. This blog will give two examples of how surveys and behavioral data can be used together. This blog is part of a Remote Data Collection Series.
Table of Contents
Biometrics add nuance to Survey Responses.
Surveys help us understand participants and consumer’s intentions and preferences. They give us explicit information about the respondents’ thoughts and feelings. Comparing participant responses to their behavior gives more nuanced insights into their experience.
Example
In this study, one participant reported that they preferred the video ad that highlighted convenience and ingredients. In their own words, this ad was:
“More about the making pizza process, which I found more entertaining and tempting than the ‘lets all chill together’ vibe of the first one.”
In that particular video ad, the scenes showing the pizza making process (rolling dough, chopping onion, grating cheese, and spreading sauce) comprised only 35% of the total ad, but made an impression on this participant.
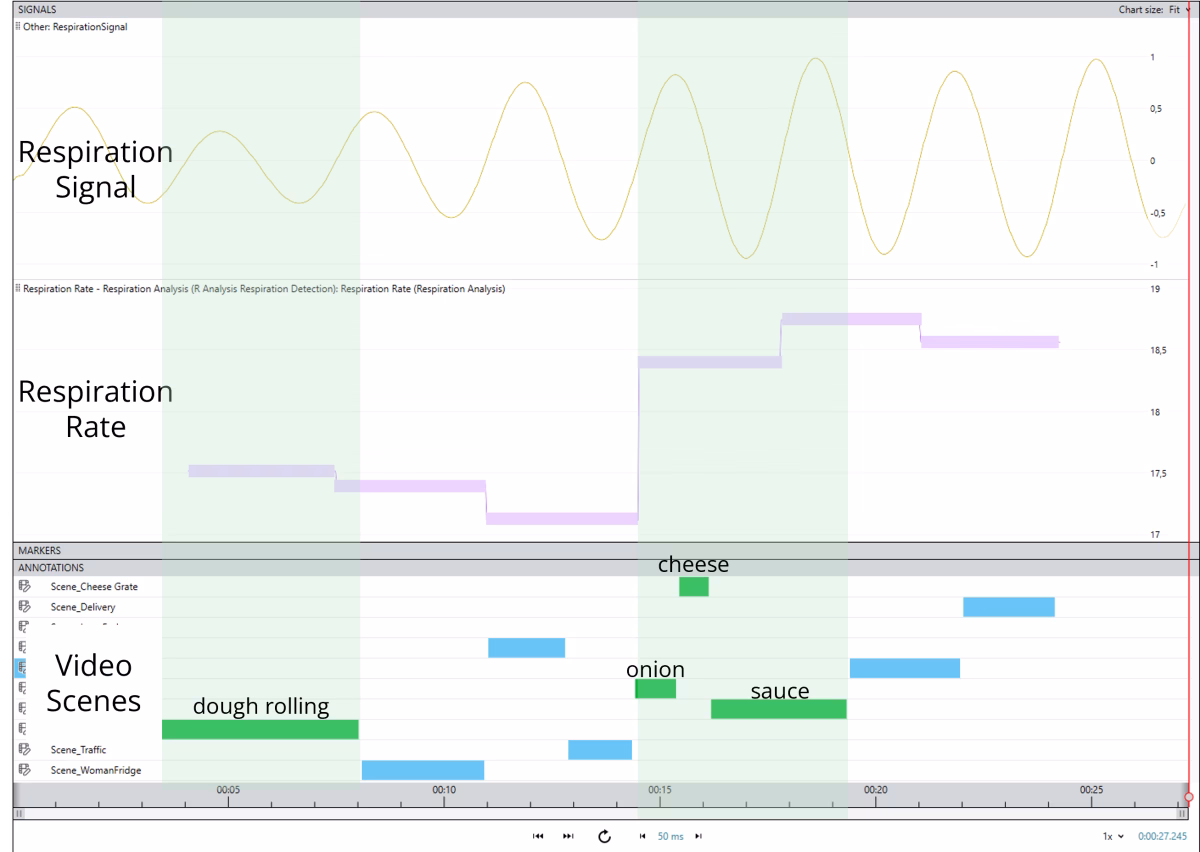
Looking at this particular participant’s respiration data, we can see that this participant had an increased respiration rate that coincides with food prep scenes, starting with chopping an onion and continuing through the rest of the ad.
This respiration data supports the respondent’s answer that they preferred scenes about making pizza. If this study was looking to brainstorm ideas for an effective ad, including more scenes related to making pizza might be an effective strategy for customers similar to this participant.
How to go beyond surveys for A/B testing with RDC
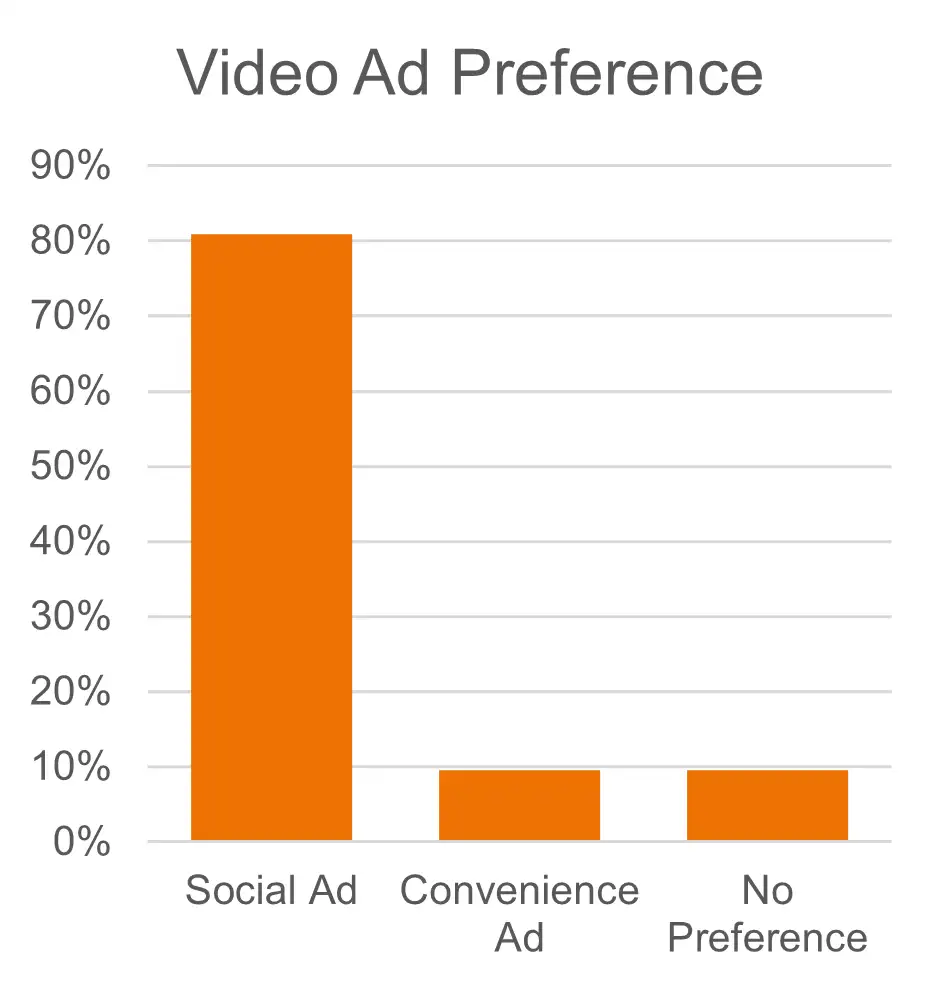
Amongst our participants, there was a clear favorite ad! Because Il Martello designed this ad to focus on more social themes, they may assume that what people liked about the ad was the social aspect.
- It could also be that this ad showed nine pizzas and the other did not show any pizzas (just a few pizza boxes at the end).
- It could also be that this ad had many scenes with people drinking beer. Perhaps participants liked the social ad more, but because they were paying attention to the beer rather than the pizza.
Interestingly, in the survey responses about why people preferred their chosen ad, most people did not use the first person (they did not use “I” or “me” in their response). Many of the responses read as people were reviewing the ad rather than reflecting on their own reaction to the ad.
Examples responses that sound like reflections:
- It shows made pizza, I like that
- I could relate to the first ad better. I could see myself more in those situations than being rushed in the second ad. Pizza is usually a planned meal for my family.
- I think they both work well.
- It relates more to me – I always buy pizza when I don’t feel like cooking, and not for any of the more “positive” motivators described in the first ad.
Examples responses that sound like evaluations:
- Both of the ads have something missing and are very generic rather than connected to the restaurant (besides the logo at the end).
- Showed cooked pizza not just ingredients
- Happy smiling people eating pizza
- More relatable and the imagery chosen was also more relatable- like younger groups of people, POC..
This pattern suggests that many people were not reporting which ad had a bigger effect on them personally, but rather reported which ad they thought would perform best generally.
This is where biometrics really come in handy. We could look at respiration rates to see which ads were the most arousing and we could look at eye tracking to see which scenes captured the most attention.
Survey Responses can facilitate analysis of Biometric data.
Survey responses can also be used to segment data from eye tracking, facial expression analysis, voice analysis and/or respiration, . By “segment the data”, we mean that we can compare data from people who grew up in one place to people who grew up in another. We could compare people that live with children to people who do not live with children.
A good strategy is to align the demographic questions with the ad targeting options you have. If you have the ability to target your ads by gender, ask respondents their gender so you can look at your data divided by gender. This way you could use your results to influence your strategy.
Example
Let’s say Il Martello was looking to target consumers with children. They want to know if participants with children pay more attention to children in scenes where there are children. They are considering developing an ad which will feature more scenes with children and families.
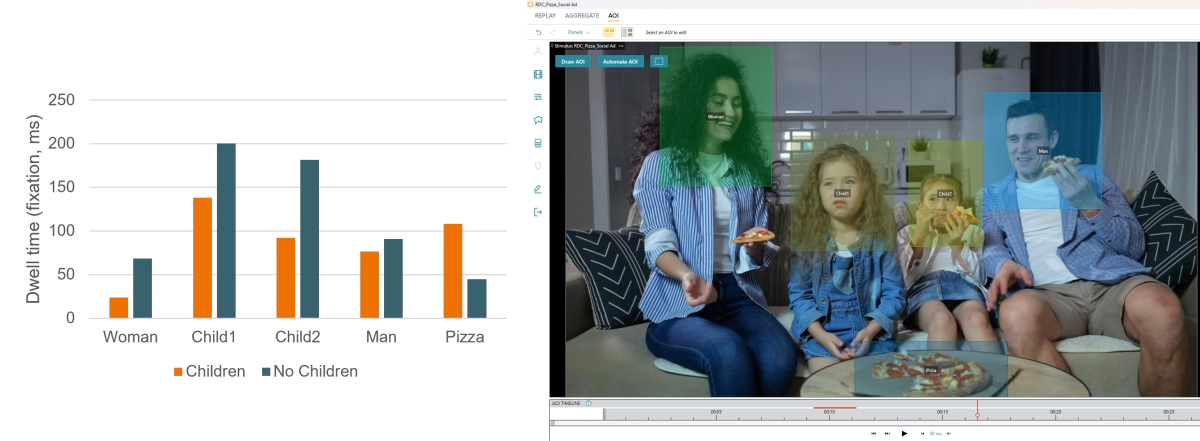
We took two different scenes from the social ad that have children, adults, and pizza in them. The graphs show comparisons of what participants who reported living with children look at (orange) compared to participants that do not live with children (blue). This is an example of subsetting the data by survey response. The data presented represents the average of the group.
From this data, Il Martello has a mixed picture.
In the first scene, participants with children looked at Child1 more than Child2. Participants without children spent more time looking at the children compared to participants without children. Participants with children were more interested in looking at the pizza on the table compared to participants with no children.
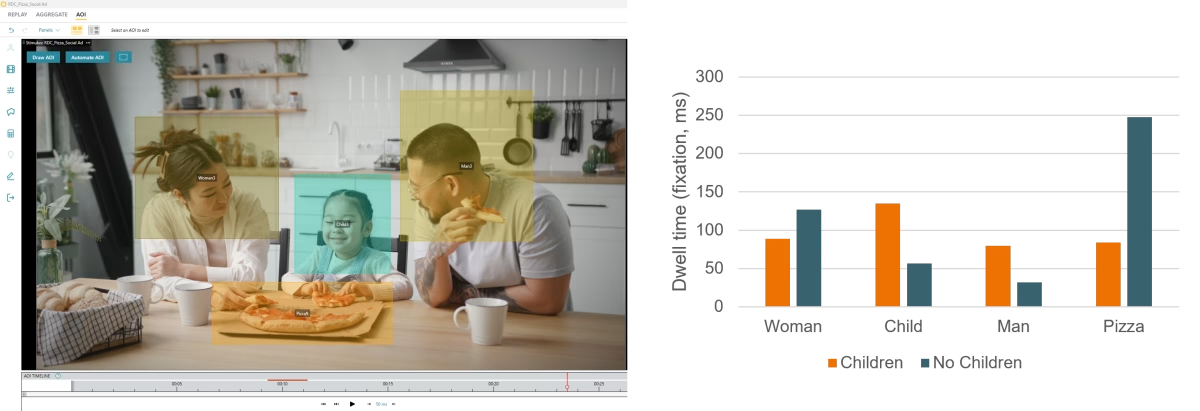
In the second scene, participants with children looked more at the child than participants with no children. Participants with no children looked more at the pizza than participants without children, the inverse of what we saw in the previous scene.
Solutions
Il Martello could decide that it is not worth making a separate ad to target potential customers with children since there is not clear evidence that these participants consistently respond differently to the scenes with children and families. They could also choose to investigate further to see why the reactions to the scenes were different.
The audio: The narrator mentions children explicitly in scene 1. “To make memories with our kids”. In scene two, the narrator says “Just Order Pizza”. One follow-up experiment would be to edit the video so that the scenes are switched but the audio is the same.
The previous scene: For scene 1, the previous scene features ballerinas sitting on the floor eating pizza. For scene 2, the previous scene shows men drinking beer and eating pizza in front of a television. Switching the scenes could help us know more about how the previous scene contributes to the reaction to the chosen scenes.
Viewing order: This data is from the first time the participants saw this advertisement. It would be relatively simple to look at only the second viewing or an average of the two viewings to see if the pattern is similar.
A different comparison: To really get to the bottom of this question, they might also want to know how participants with children responded to scenes without children compared to scenes with children.
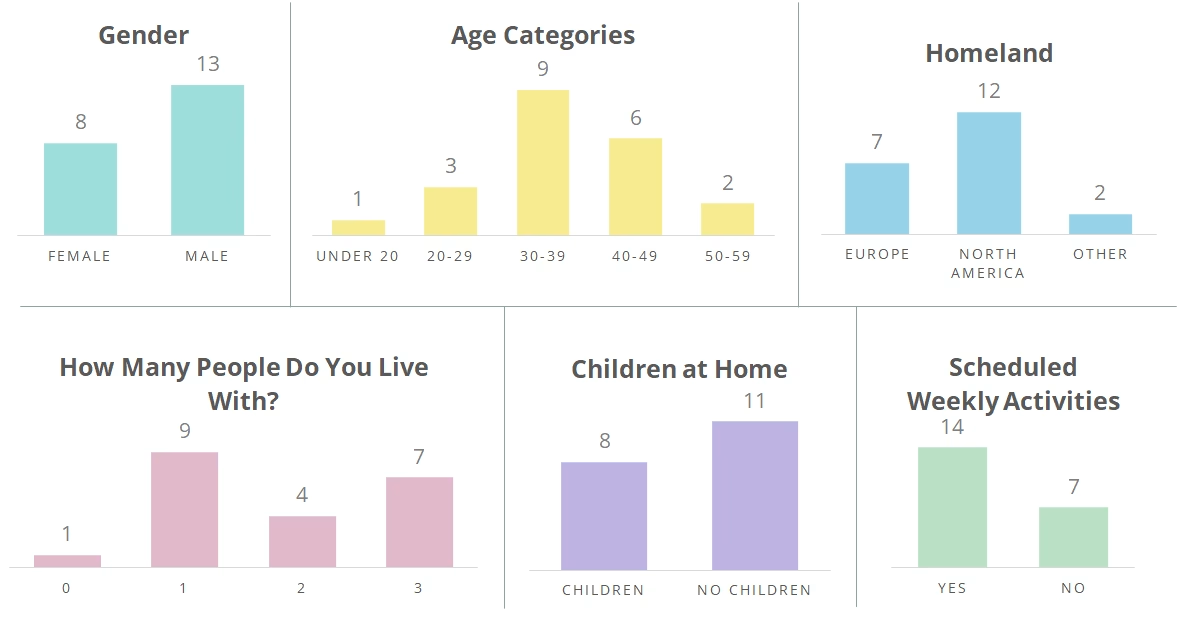
Below is a summary of some of the demographics survey data. This shows some other categories we could have used to subset the data.
Conclusion
Surveys and biometrics together make for a more nuanced and powerful analysis. Biometrics add nuance to survey responses and help researchers dig a little deeper into their data. Surveys help researchers extract actionable insights from their biometric data.