Our latest software release – iMotions 8.0 – is a culmination of over a year of work and dedication to improve the iMotions software. We thought we’d take this opportunity to give a walkthrough of the new and improved features within iMotions 8.0, and to give a more thorough overview of what is now possible in this latest software release.
New analysis options with R
R is a statistical software language and environment for computing statistical analyses. It is a powerful and flexible platform, which allows users to carry out virtually any analysis they can code and create (there is also the possibility to edit, configure, and use publicly available and pre-built analysis methods).
As a statistical platform it is revered and also often scorned – the possibilities for using it are enormous, but the learning curve is steep. Getting over the initial hurdles of learning how to use R can be challenging, even if the payoff is great.
While there are a range of data processing / analysis features available in the iMotions software (see this blog post for a few that are available for eye tracking), we want to provide more methods that can ease the process at the later stage of study completion.
By bundling R into iMotions 8.0, we’re able to take advantage of the analysis possibilities offered without placing the burden of coding statistical tests onto our users. The first roll-out of data processing techniques that use R within iMotions are:
- Power spectral density for EEG data
- Frontal asymmetry calculations for EEG data
- EDA / GSR peak detection
Power spectral density is essentially a measure of the amount of EEG data that is collected within a certain frequency band. This can show, for example, how much alpha band (7-12 Hz) activity was recorded from each electrode. This provides a way of summarizing the level of activity across different parts of the brain (or, when collected together, the level of activity of the brain in general).
Frontal asymmetry (a topic we’ve covered in a blog post before), is a measure of how much frontal brain activity differs across hemispheres. This is typically done by comparing EEG data between F3 and F4, or F7 and F8 electrodes.
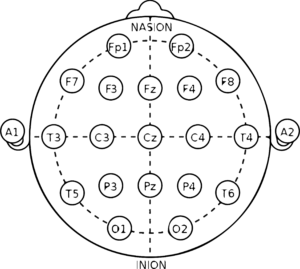
The amount of asymmetry between these areas has been associated with increased motivation to approach or withdraw from a stimulus [1, 2], with increased alpha band activity in the left hemisphere (relative to right) being associated with approach motivation (and vice versa).
EDA / GSR peaks reflect a significant increase in skin conductance above the baseline / tonic level. Our skin produces a constant signal, which can increase as a byproduct of an increase in physiological or emotional arousal. A peak in the data therefore can therefore provide crucial data about the participant’s reaction to stimuli, by highlighting how much of a change in emotional arousal it caused.
These measures are now available in iMotions and readily calculated by simply clicking on “signal processing” within the analysis screen, and then selecting the relevant device and algorithm. The results can then be shown by graphs and also exported for further testing if needed.
Integration with Varjo
Varjo is a company that makes the Varjo VR-1 headset, a VR headset with built-in eye tracking. In terms of VR devices it stands out from the crowd, with human-eye level resolution. The resolution in the headset is 60 pixels per degree, making the resolution 10 times higher than any other VR headset currently available.
Varjo devices are used by technology companies such as Audi, Saab, and Siemens, as well as architecture firm Asymptote Architecture, among others. The applicable use cases have been centered on different aspects of design and training, whether for car development, architectural planning, medical simulation, or pilot training.
Data from the built-in eye tracking can be seamlessly synchronized live with signals from biosensors, such as EDA (electrodermal activity), EMG (electromyography), ECG (electrocardiography), and EEG (electroencephalography). The use of multimodal biosensor data in the iMotions platform can provide insights about the user’s emotional and physiological states as they experience the virtual environment.
New and improved integrations
The release of iMotions 8.0 includes new and upgraded integrations with several partners. The SDK has been updated for the Smart Eye Aurora eye tracker, allowing a two computer setup as well as data individually regarding the left and right eye position, creating the possibility to collect richer data. A verification step has also been added to the gaze calibration workflow, ensuring the data quality is optimal for experiments.
A new integration with the Emotiv Cortex SDK is now also included, providing access to a range of data obtained through Emotiv EEG devices. This includes the raw EEG data, accelerometer data, and the collection of Emotiv metrics, such as Stress, Relaxation, Engagement, Focus, Excitement, and Interest (to read more about what each metric refers to, visit this page here).
These metrics provide an overview of the cognitive state of the participant, providing a quick breakdown of the way in which an individual responds to stimuli. The metrics have been validated in various studies [e.g. 3] (visit this link to see more).
Furthermore, various improvements have been made to EyeTech integration with the calibration, settings, and the ability to record the participant’s distance from the eye tracker.
New gaze mapping features
Gaze mapping is a feature in iMotions that allows the different dynamic views of participants to be transformed into the same image, even if the way in which they see a stimulus is different.
This feature can be used with both real-world scenes, in which eye tracking glasses are worn, and also with viewing websites, in which the webpages can be viewed and scrolled through in different ways. Both of these scenes can involve participants viewing essentially the same stimulus or stimuli, but in variable ways.
Gaze mapping involves transforming the scene into a single image. For example, if multiple people view a supermarket shelf in different ways, their gaze can be transposed onto a reference photo of the supermarket shelf. For a website, this involves constructing a complete webpage, and transposing the different views onto the same whole page.
This is a powerful tool for assessing and understanding the gaze of multiple participants who view the same environments, but interact with them in different ways. While this works in most cases, the algorithm that automatically transforms the gaze can be challenged – for example by particularly steep angles of approach (e.g. someone approaching a supermarket shelf from the side – the algorithm may not be able to identify the commonalities between the single image on which to transform the gaze points, and the actual viewed scene).
A solution to these technical challenges is presented in iMotions 8.0. For real-world scenes in which eye tracking glasses are worn, the areas in which gaze mapping could not be completed can be edited. The corners of the reference photo can be manually paired with the view of the participants. As these are entered, the gaze mapping algorithm can then continue to automatically process the subsequent frames. This can be repeated if necessary, until the gaze mapping is complete.
For webpages a similar problem is encountered, but the angle of approach is not the problem at hand. Many webpages feature moving images or videos, that can create noise in the way in which the gaze mapping algorithm processes the scene. It’s now possible to define the areas which should be excluded from the analysis, providing a clean slate for the algorithm to map the gaze.
Both of these improvements allow eye tracking data to be collected in particularly challenging scenarios, which opens up the flexibility for both real-world and website-based studies.
Conclusion
There are other improvements in iMotions 8.0 that are not mentioned above, such as improvements to the synchronization of datastreams, and increased data export options. To get more of an overview, visit our release page, or the complete release notes (current customers only).
If you’d like to learn about the possibilities afforded by the iMotions software, download our brochure below.
References
[1] Coan, J. A., & Allen, J. J. (2004). Frontal EEG asymmetry as a moderator and mediator of emotion. Biological Psychology, 67, 7–50.
[2] Harmon-Jones, E., & Allen, J. J. (1998). Anger and frontal brain activity: EEG asymmetry consistent with approach motivation despite negative affective valence. Journal of Personality and Social Psychology, 74, 1310 –1316.
[3] Badcock, N. A., Mousikou, P., Mahajan, Y., de Lissa, P., Thie, J. and McArthur, G. (2013). Validation of the Emotiv EPOC(®) EEG gaming system for measuring research quality auditory ERPs, PeerJ, 1, e38.