Elevate your Behavioral Research with Accelerometry to enhance data analysis. Discover how this technology introduces a new dimension to your research methodologies, providing valuable insights. Utilize accelerometry to advance your findings and deepen the understanding of behavioral patterns for comprehensive research outcomes.
Table of Contents

TLDR section:
The Accelerometry Notebook Algorithm uses device sensors to extract data of physical movement and provide the following benefits:
- Extract movement data from supported devices
- Customize detection thresholds to identify meaningful movement
- Generate raw data signal for movement in X, Y, Z, movement magnitude, movement detection and peak detection
- Get accelerometry metrics such as: Count Of Movement, Time Moving (ms), Percentage Moving (%), Average Movement Duration (ms), Average Acceleration Magnitude (m/s^2), Average Peak Acceleration (m/s^2), Movement Threshold (m/s2)
- Generate movement markers for onset movement, offset movement and movement peaks
- Generate annotations based on movement markers to simplify analysis
We are excited to introduce a powerful new feature: the accelerometry notebook. This feature enables movement detection, seamlessly integrated into the iMotions Lab platform, enhancing your research workflow.
Why is movement detection important in research?
Movement data plays a critical role in various types of studies, whether for data quality control, as a marker of key events, or even as a physiological response itself.
1. Data Quality Control
In many cases, movement can compromise data quality. For example, Galvanic Skin Response (GSR) measurements are highly sensitive to movement artifacts, which can distort results. By detecting movement, researchers can identify and exclude segments of data affected by motion, ensuring cleaner and more reliable results.
2. Movement as a Marker of Key Events
Movement can often indicate critical moments within an experiment, helping researchers pinpoint when key interactions or physiological responses occur.
In product testing, movement detection helps researchers pinpoint key interaction moments, such as when a participant applies a product. This allows for more precise analysis of the physiological responses that follow.
Similarly, in sports science, tracking movement can help capture the body’s immediate physiological response after a swing in baseball or golf, providing valuable insights.
3. Movement as a Physiological Response

In some cases, movement itself is a direct measure of interest. In human factors and ergonomics, excessive fidgeting while using a newly designed chair or desk could indicate discomfort, guiding improvements in product design.
Likewise, in behavioral research, the way a person moves-or the extent to which they do-can reveal levels of stress, engagement, or relaxation in different environments.
Accelerometry data is as versatile as it is powerful. Whether used to clean data by filtering out movement artifacts or as a proxy for behavioral patterns, its potential is only limited by creativity. By integrating movement detection into your studies, you can enhance data accuracy, uncover meaningful behavioral insights, and gain a deeper understanding of participant responses.
How does it work?
As mentioned earlier, our new accelerometry feature leverages the built-in capabilities to collect movement data of supported devices, such as GSR sensors and eye-tracking glasses. If you’re unsure whether your device includes accelerometry, it’s best to check with the manufacturer.
After data collection, you’ll find the Accelerometry Processing algorithm in the Signal Processing tab, alongside other R-notebook processing tools. Here, you can set a threshold for movement detection, allowing the software to generate accelerometry signal data on your timeline.
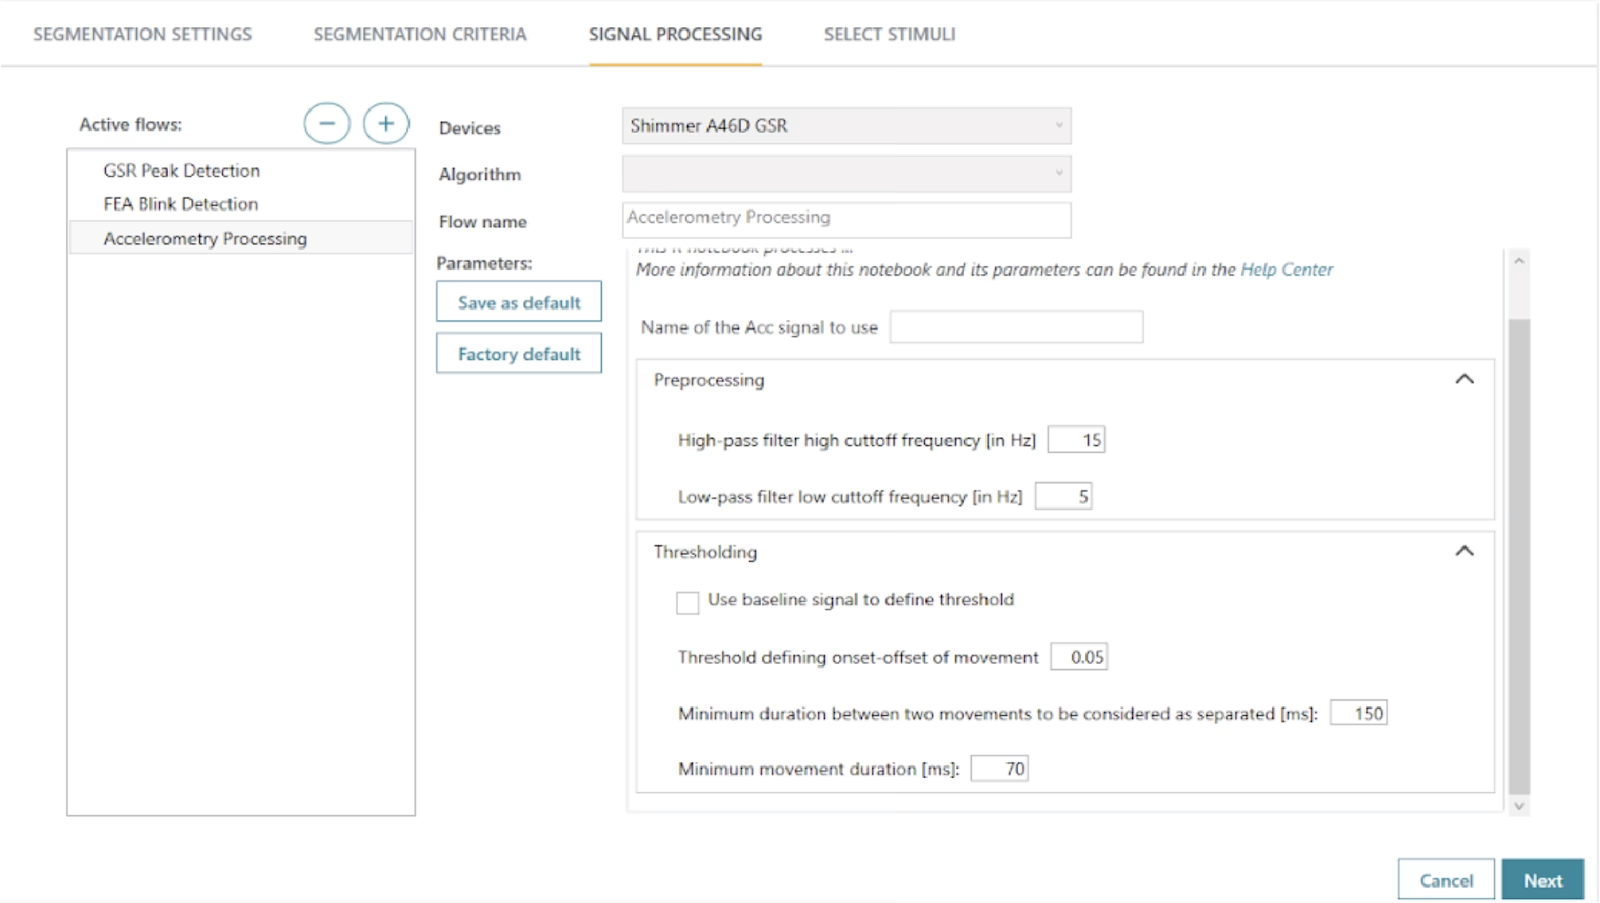
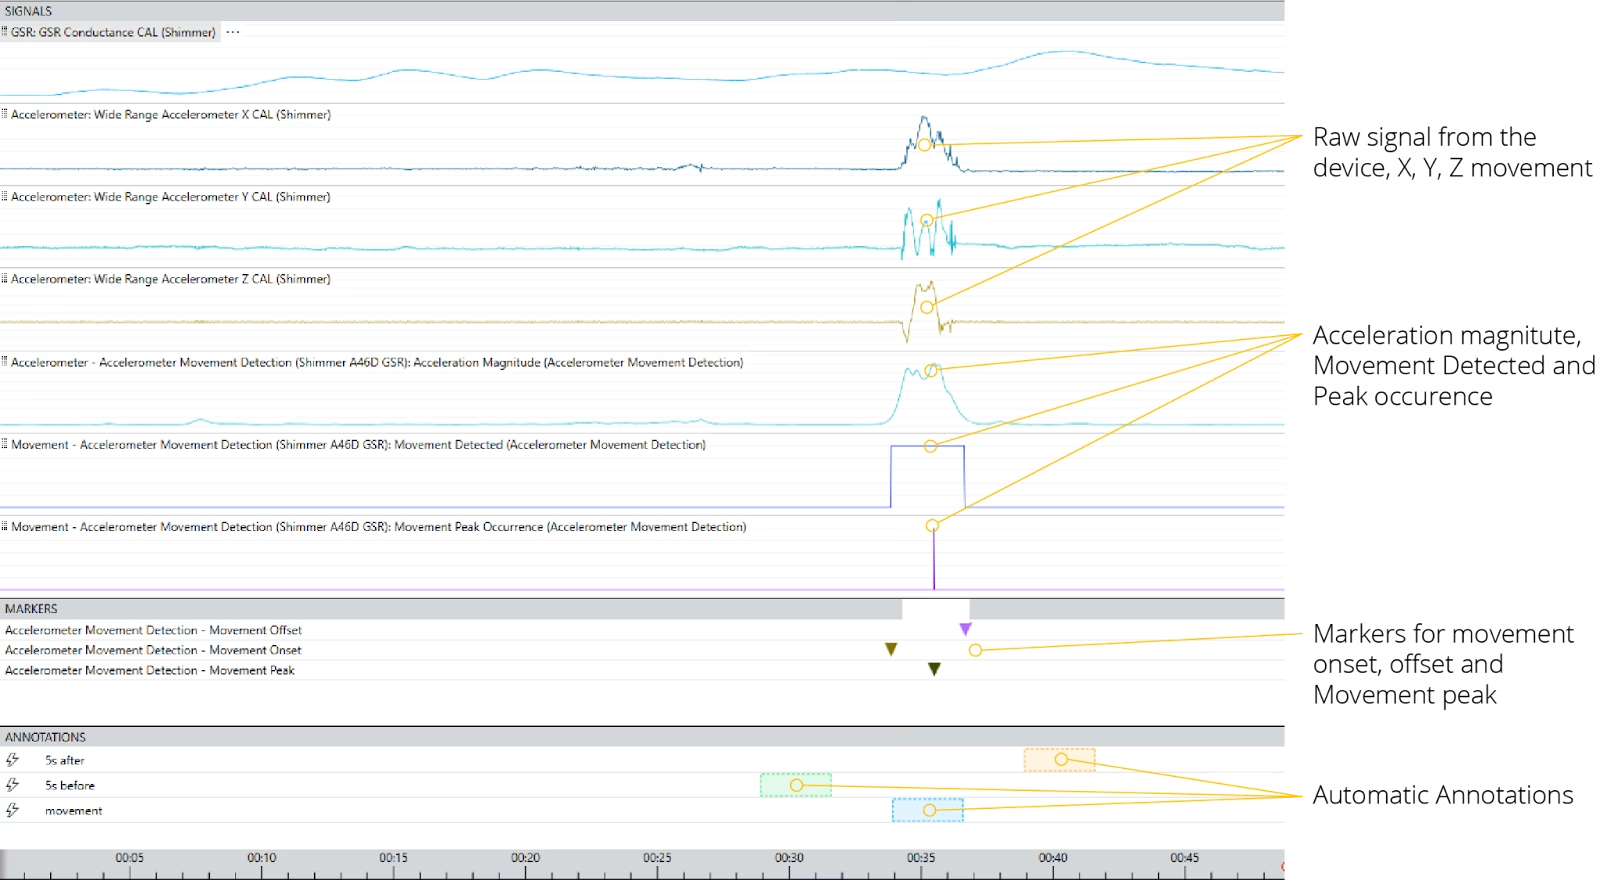
These signal data include raw data corresponding to X, Y, and Z movement and acceleration magnitude. Additionally, the iMotions software provides a signal for Movement Detection and Peak Detection.
Alongside you get also summary for:
- Count Of Movement,
- Time Moving (ms),
- Percentage Moving (%),
- Average Movement Duration (ms),
- Average Acceleration Magnitude (m/s^2),
- Average Peak Acceleration (m/s^2),
- Movement Threshold (m/s2)
With all of this data, the software automatically generates markers for movement onset, offset, and movement peak. These markers can then be used to create automatic annotations, which you can customize to fit your research needs.
Whether you’re annotating movement periods or focusing on data before or after movement, these annotations help streamline segmentation, making your analysis more structured and insightful.
With the iMotions’ accelerometry notebook, movement detection is no longer an afterthought-it’s an integral part of your research workflow. Whether you need to clean your data, mark key events, or analyze movement as a behavioral response, this feature gives you the power to work smarter and uncover deeper insights.