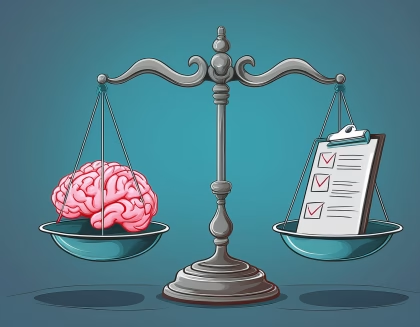
A customer journey map visualizes the steps a user takes on a website, from entry to purchase or information acquisition. It identifies key touchpoints, user emotions, and pain points, providing insights into optimizing the user experience. Using tools like eye tracking and facial expression analysis enhances this understanding, offering deeper behavioral insights.
Table of Contents
Customer Journey Mapping with Eye Tracking and Facial Expression Analysis on a Website
A Customer Journey is a person’s journey from A (entry) to B (purchase or correct information acquisition) on any given website. Understanding your customers’ experiences on your website is crucial for optimizing their journey and ensuring they find what they need with ease. Mapping out a customer journey helps you visualize and enhance these experiences. In this article, we’ll explore what a customer journey is, the importance of customer journey mapping, how you can gain deeper insights with biosensors, and how you can create an effective journey map to improve user experiences on your website.
What is a Customer Journey?
In a broad sense, a customer journey can be as long or as short as makes sense for your business case. In this instance, we are looking at it from a UX perspective as that is the most concise stimuli we have when later applying biosensors to our mapping.
As mentioned before, a customer journey refers to the complete sequence of interactions and experiences a customer has with your brand, from the moment they enter your website (and where you enter it from) to their eventual purchase of whatever that website is selling. This journey includes every step a customer takes, from initial contact through to purchasing, using, and advocating for your products or services. Understanding the customer journey helps businesses anticipate customer needs, remove barriers, and create a smoother path to conversion.
What is a Customer Journey Map?
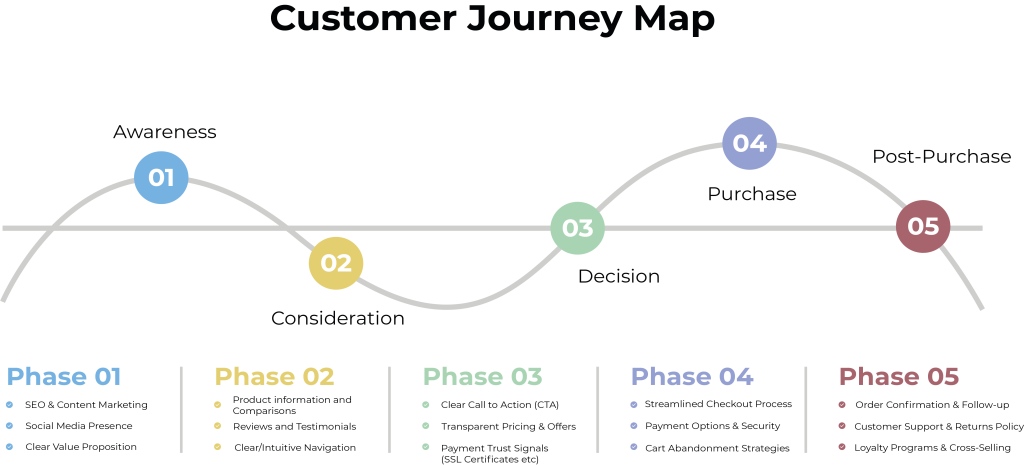
A customer journey map is a visual representation of the steps and interactions a customer goes through during their journey from entry to exit on your website. It outlines key stages such as awareness, consideration, decision, and post-purchase, highlighting touchpoints, customer thoughts, emotions, and pain points. This map allows you to see the journey from the customer’s perspective, providing insights into how to improve their experience.
This example of a Customer Journey Map is a general representation of a person’s journey through a website, divided into the different phases the process goes through. The notes at the bottom are meant as checklists for features that are important to have in the different phases.
Increase Customer Journey insights with Eye Tracking and Facial Expression Analysis
Customer journeys are traditionally measured using session tracking software such as Google Analytics, Microsoft Clarity, Hotjar and many others. They work by recording user sessions, where mouse-clicks, scrolling and site navigation are merged to give an overview of customer behavior, drop-off points and session length.
While those metrics are very important for journey mapping, they do not tell you much about the customers themselves. By integrating biosensors, specifically eye tracking (either screen-based or webcam) and facial expression analysis (FEA), you can gain insights on metrics such as, attention, frustration, joy and concentration among others. This helps you build a much better understanding of your users, and therefore a much more effective and robust customer journey map.
How to Create a Customer Journey Map Using Eye Tracking & FEA?
For those with a good understanding of customer journey mapping and interested in leveraging cutting-edge techniques like eye tracking and facial expression analysis, the following steps outline how to integrate these tools into your journey mapping process. These advanced methods provide deep insights into user behavior and emotions, enabling you to create a more accurate and empathetic customer journey map.
1. Define the Objectives and Hypotheses
- Objective Setting: Start by clearly defining what you want to achieve with eye tracking and facial expression analysis in your customer journey map. This could include understanding how users interact with specific elements on your website, identifying emotional responses at key touchpoints, or uncovering unconscious behaviors that impact decision-making.
- Formulate Hypotheses: Develop hypotheses about potential pain points, engagement triggers, or emotional responses that you believe are critical to the customer journey. This will guide the focus of your eye tracking and facial expression analysis.
2. Identify Key Touchpoints for Analysis
- Pinpoint Critical Touchpoints: Determine the specific touchpoints in the customer journey where visual attention and emotional reactions are most crucial. These could include landing pages, product pages, checkout processes, or customer support interactions.
- Prioritize Based on Impact: Prioritize touchpoints where small changes can lead to significant improvements in user experience or conversion rates.
3. Recruit Participants and Define Personas
- Select Target Personas: Recruit participants that represent your key customer personas. Ensure that these participants align with the segments you’re focusing on for the journey mapping.
- Ensure Diversity: Include a diverse group of participants to capture a wide range of behaviors and emotional responses, providing a comprehensive view of your customer journey.
4. Design the Study: Eye Tracking and Facial Expression Analysis
- Set Up Eye Tracking: Implement eye-tracking technology on your website or within a controlled environment to monitor where and how long users look at different elements. This could involve hardware-based eye trackers or software that uses webcams.
- Incorporate Facial Expression Analysis: Use facial expression analysis tools to capture real-time emotional reactions as users navigate through the journey. These tools can detect micro-expressions and emotional states such as frustration, confusion, satisfaction, or joy.
- Synchronize Data Collection: Ensure that eye tracking and facial expression data are collected simultaneously and synchronized with the user’s journey through the touchpoints. This will allow for a cohesive analysis of visual attention and emotional response.
5. Conduct the Usability Sessions
- Run Controlled Sessions: Have participants navigate through the key touch points while their eye movements and facial expressions are recorded. Provide tasks that align with typical user goals to mimic a real-world journey.
- Capture Behavioral Data: Alongside visual and emotional data, collect behavioral data such as click paths, time spent on tasks, and navigation patterns. This holistic approach will enrich your analysis.
6. Analyze Eye Tracking and Facial Expression Data
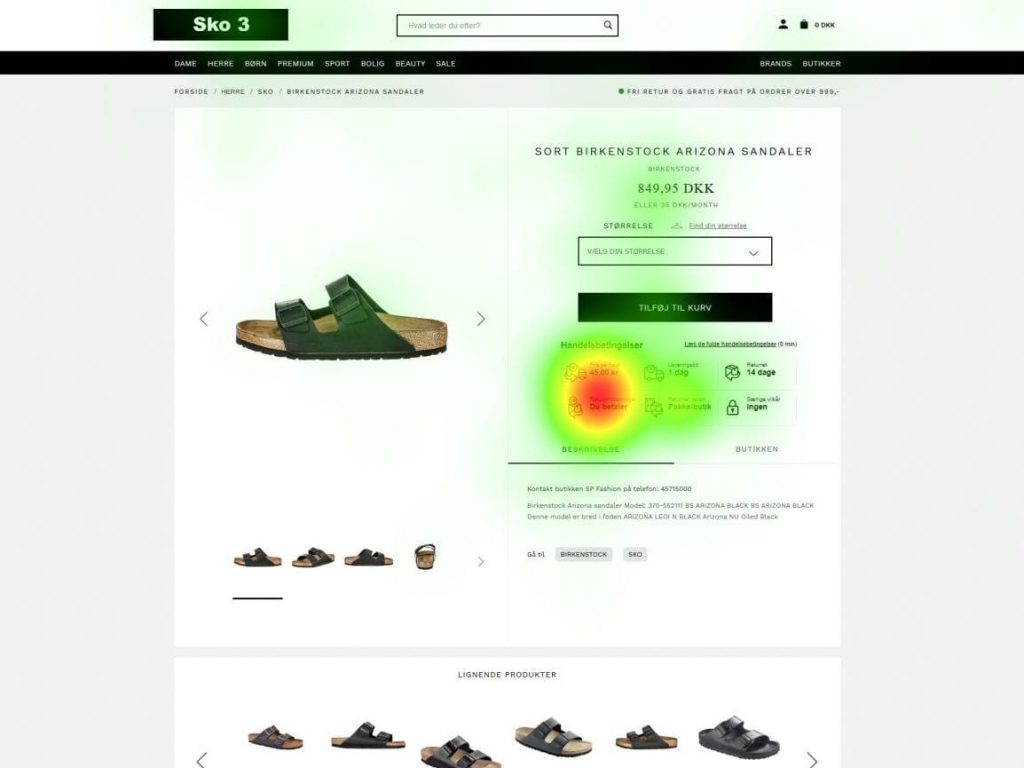
- Heatmaps and Gaze Plots: Use eye-tracking data to generate heatmaps and gaze plots that visualize where users look, the sequence of their visual attention, and areas that are ignored. Identify patterns that reveal how users interact with different elements at each touchpoint.
- Emotion Mapping: Analyze facial expression data to map emotional responses at each stage of the journey. Correlate these emotions with specific actions or inactions to understand the underlying causes.
- Combine Data Streams: Integrate eye tracking, facial expression, and behavioral data to create a detailed picture of the customer experience. Look for correlations, such as how prolonged focus on a specific area correlates with frustration or satisfaction.
7. Map Out the Journey with Insights
- Visualize the Journey: Create a customer journey map that incorporates insights from the eye tracking and facial expression analysis. Highlight the stages, key touchpoints, emotional responses, and areas of visual attention.
- Annotate with Findings: Annotate the journey map with key findings such as points of high frustration, elements that are frequently overlooked, or areas that elicit positive emotions.
8. Identify Optimization Opportunities
- Pinpoint Design Improvements: Use the insights to suggest specific design changes, such as repositioning elements that are frequently overlooked or simplifying areas that cause frustration.
- Emotion-Driven Enhancements: Propose enhancements that address emotional pain points or amplify positive experiences. For example, if users show confusion during the checkout process, simplify it to reduce cognitive load and frustration.
9. Test and Iterate
- Implement Changes: Make the suggested changes to the touchpoints and conduct follow-up studies to measure the impact.
- Continuous Improvement: Iterate on the process by periodically repeating eye tracking and facial expression analysis to ensure that the journey continues to meet user expectations and business goals.
What Are Touchpoints in Customer Journey Mapping?
Touchpoints in customer journey mapping refer to the specific moments where customers interact with your brand. These interactions could occur on your website, through social media, via email, or in-person. Mapping touchpoints helps you understand where customers engage with your brand, what their experiences are like at each interaction, and how these moments contribute to their overall journey. By identifying and optimizing touchpoints, you can create a seamless and positive customer experience.
Which Components Are Part of the Customer Journey?
The components of a customer journey typically include the following:
- Customer Stages: These include the phases of awareness, consideration, decision, retention, and advocacy.
- Touchpoints: Key interactions that customers have with your brand.
- Channels: The mediums through which touchpoints occur, such as websites, social media, or emails.
- Customer Actions: The specific actions customers take at each stage, such as clicking a link, reading a blog post, or making a purchase.
- Emotions and Motivations: Understanding how customers feel and what drives them at each stage.
- Pain Points: Identifying obstacles or frustrations that customers encounter during their journey.
- Opportunities: Areas where improvements can be made to enhance the customer experience.
What is Customer Journey Analytics?
Customer journey analytics involves the collection, analysis, and interpretation of data related to the customer journey. This data-driven approach allows businesses to track customer behavior, measure the effectiveness of different touchpoints, and understand how customers move through various stages of their journey. By leveraging customer journey analytics, businesses can make informed decisions to optimize the user experience, improve conversion rates, and increase customer satisfaction.
Analyzing Eye Tracking and Facial Expression Data
To effectively analyze eye tracking and facial expression data in your Customer Journey research, the checklist below covers the most important point you need to follow:
- Visual Data Analysis: Use heatmaps and gaze paths to visualize where users are focusing their attention on a webpage. Heatmaps provide a color-coded view of the most viewed areas, while gaze plots track the order in which users look at different elements. This helps identify which parts of the page are most engaging or distracting.

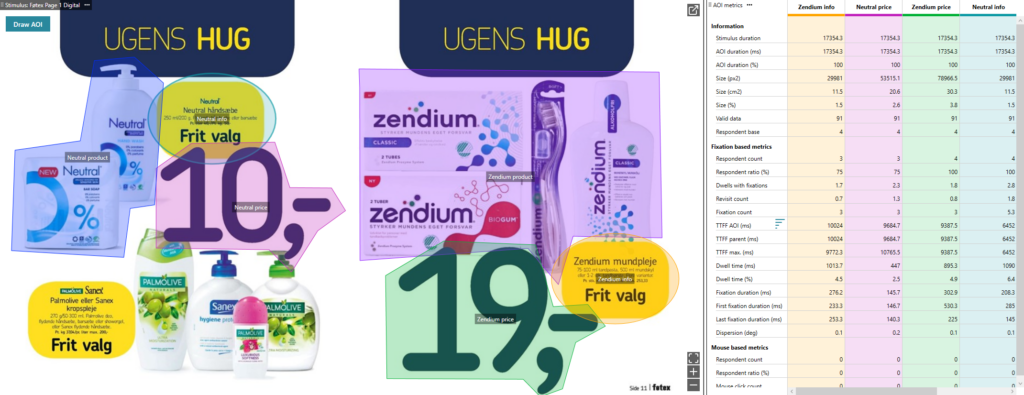
- Area of Interest (AOI) Analysis: Define specific areas of interest on the webpage, such as buttons, images, or forms, and measure how much time users spend looking at these areas. AOI analysis reveals which elements attract the most attention and whether they effectively guide users through their journey.
- Emotional Mapping: Map the emotions detected through facial expression analysis, such as joy, frustration, or surprise, at different points in the customer journey. This helps identify how users feel when interacting with various elements and content on the site.
- Correlate Attention and Emotion: Combine eye tracking and facial expression data to see how visual attention correlates with emotional responses. For instance, if users spend a lot of time on a product page but show signs of frustration, it may indicate confusing content or navigation issues that need to be addressed.
- Sequence Analysis: Examine the sequence of visual attention and corresponding emotional reactions to understand user navigation paths and potential friction points. This can help determine whether users are experiencing a smooth journey or encountering obstacles that cause negative emotions.
- Pattern Identification: Identify patterns such as high engagement with specific elements but low conversion rates or signs of frustration on particular pages. Recognizing these patterns helps pinpoint areas for improvement and enhance the overall user experience.
- Segmentation Analysis: Analyze data by different user segments (e.g., new vs. returning visitors, demographic groups) to understand how various customer types interact with the website. This enables tailored optimizations to better meet the needs of diverse audiences.
Conclusion
Mapping and analyzing the customer journey on a website is essential for enhancing the user experience. By examining each step of a customer’s interaction with your brand-from entry to purchase or information acquisition-you can identify key touchpoints, understand customer emotions, and pinpoint barriers to conversion. Traditional analytics tools provide valuable data on user behavior, but integrating advanced techniques like eye tracking and facial expression analysis offers much deeper insights.
Comprehensively analyzing customer journeys is about understanding not just what users do on your website, but why they do it and how they feel. Leveraging these insights allows businesses to enhance the customer experience, driving better engagement, conversion rates, and loyalty.
Free Pocket Guides

iMotions Sensory and Consumer
Research Services
Whether you require a full-service research project, partial research services, or specialized data analysis, our team of experts is ready to assist you.
We carry out tests for

Consumer Research
Sensory Research
Claims Testing
Fragrance Testing
UX Testing
Eye Tracking Studies
Media Testing
(Ads, video, etc)