
Deciphering consumer motivation involves understanding the emotional responses that drive purchasing decisions. By utilizing biosensors, such as Facial Expression Analysis (FEA) and Galvanic Skin Response (GSR), researchers can measure emotional valence and arousal. This data provides valuable insights into consumer behavior, enabling brands to tailor their offerings to better align with customer motivations.
Table of Contents
Why does anyone buy anything? Trying to decipher why people buy a specific product, subscribe to a certain service or just generally favor one brand over another, can seem like trying to find a needle in a huge stack of identical needles. That is because it sort of is.
What motivates a consumer in their purchasing is unique to that particular consumer, with influences being a wide range of needs, wants, aspirations and limitations. So, why is consumer motivation so important if it seems nearly impossible to pin-point? It is important because every single purchase decision made on earth has motivation behind it – and a large part of what influences these motivations can be studied.
What Motivates a Consumer to Buy?
Consumer motivation, or sometimes Consumer Behavior, is a complex interplay of various influences, deeply rooted in the world around us and intertwined with personal needs, wants, and desires. As social beings, we are constantly shaped by external factors-whether through advertisements, recommendations from friends, or our unique life experiences. However, it is nearly impossible to fully account for all the external factors in a person’s emotional responses. Yet, it is possible to measure specific scenarios where these factors undoubtedly play a significant role.

Our individual motivations may form a distinct blend of these influences, but the forces driving them are often shared and universal. We are, often unconsciously, guided by these global and local emotional influences. Consider major brands like Coca-Cola, McDonald’s, and Apple, who capitalize on this by creating global ad campaigns designed to resonate with a worldwide audience. Their marketing efforts are not just about selling products; they embed these products into a shared global experience, anchoring them in the collective global consciousness.
The same can be said for a variety of goods, regardless of brand, such as high-level consumer goods like coffee, wine, or chocolate. Luxury goods are often marketed similarly across the globe, tapping into notions of attainable luxury, indulgence, and authenticity-all of which are universally lauded as desirable aspects of life.
In essence, we are all living in a consumer zeitgeist where global currents influence our purchasing motivations. While these external factors are difficult to isolate entirely, examining specific instances where they play a role can provide insights into how these influences translate into actual consumption of specific products.
Emotional Valence as a Predictor of Consumer Motivation
Understanding Consumer motivation, down to the individual consumer and individual product is a laborious task. Luckily neuroscience has a solution that gets to the center of the issue, namely recording and analyzing emotional responses of consumers.
Emotional responses in regards to consumer motivation is the act of recording the positive or negative quality of an emotional experience with a specific brand or service. Based on many individual experiences, brands and businesses can get a holistic view of how consumers react to their products.
How to Measure Emotional Valence with Biosensors – A Walkthrough.
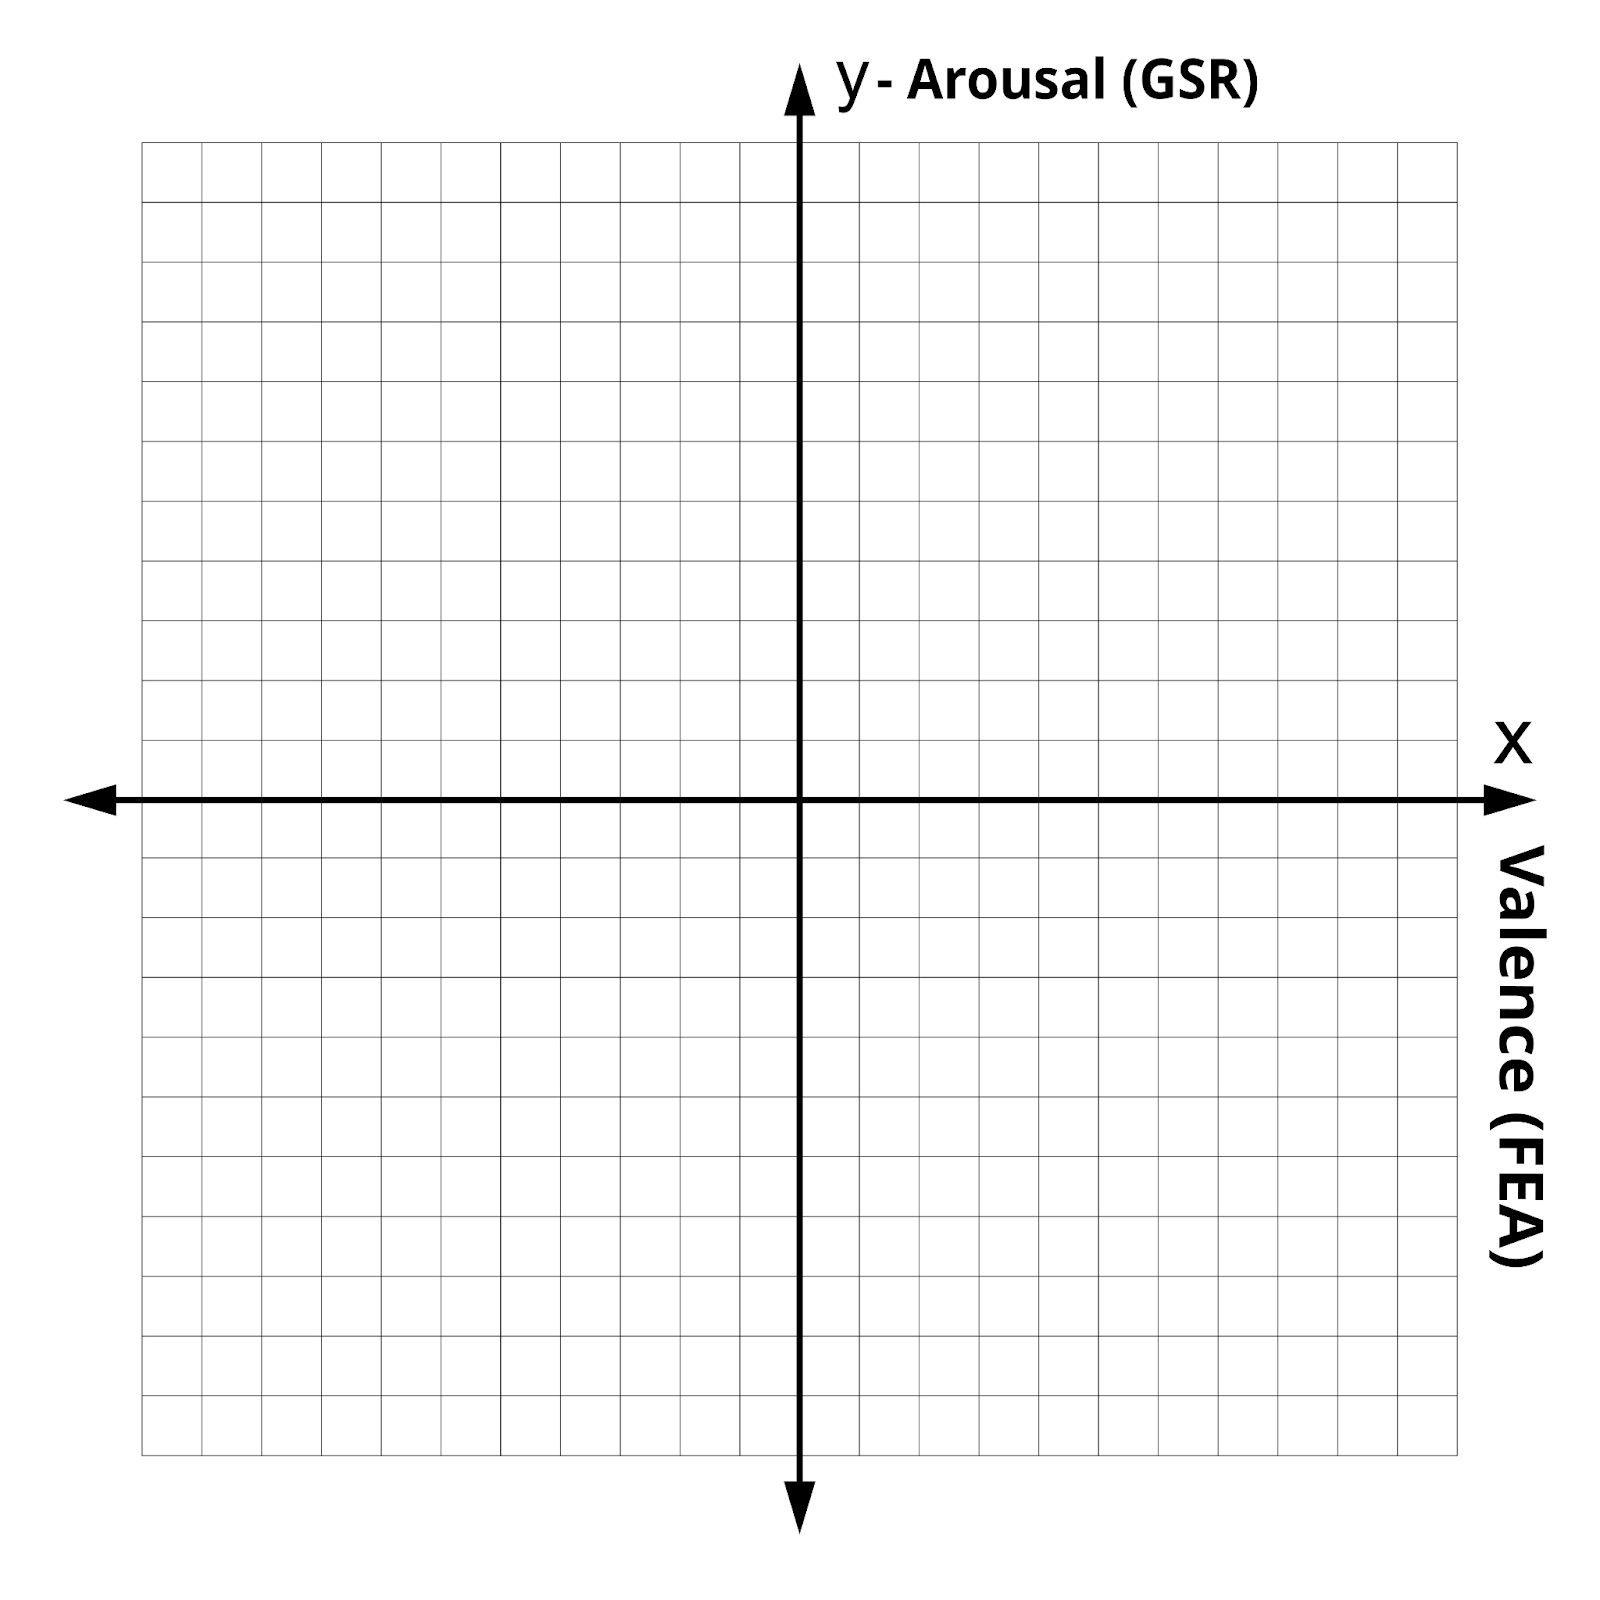
In practical application, emotional valence is often deduced by plotting Valence metrics and Arousal metrics into an X/Y grid. The correlated metrics will then form the conclusion. To illustrate a basic research setup we could use Facial Expression Analysis (FEA) as the valence indicator (X) and Galvanic Skin Response (GSR) as the arousal indicator (Y).
GSR measures the conductivity of the skin, where increasing levels of microsweat indicates increasing arousal levels. It is important to note that GSR cannot distinguish between positive and negative emotions, it can only reflect the intensity of the emotional response. For the emotional metrics, we turn to FEA, one of the most popular modalities for measuring emotional valence. FEA analyzes facial expressions and categorizes them into emotional states, such as joy, fear, sadness or happiness.
Breakdown of GSR and FEA output combinations
By plotting GSR on the Y-axis researchers can observe the level of emotional Arousal, while FEA on the X-axis gives researchers a measure of emotional Valence. Different readings could look like this:
High GSR + Positive FEA (e.g., smiling): Indicates high arousal with positive valence, suggesting excitement.
High GSR + Negative FEA (e.g., frowning): Indicates high arousal with negative valence, suggesting stress.
Low GSR + Positive FEA: Suggests a calm, positive state, such as contentment.
Low GSR + Negative FEA: Suggests a calm but negative state, such as boredom or mild displeasure.
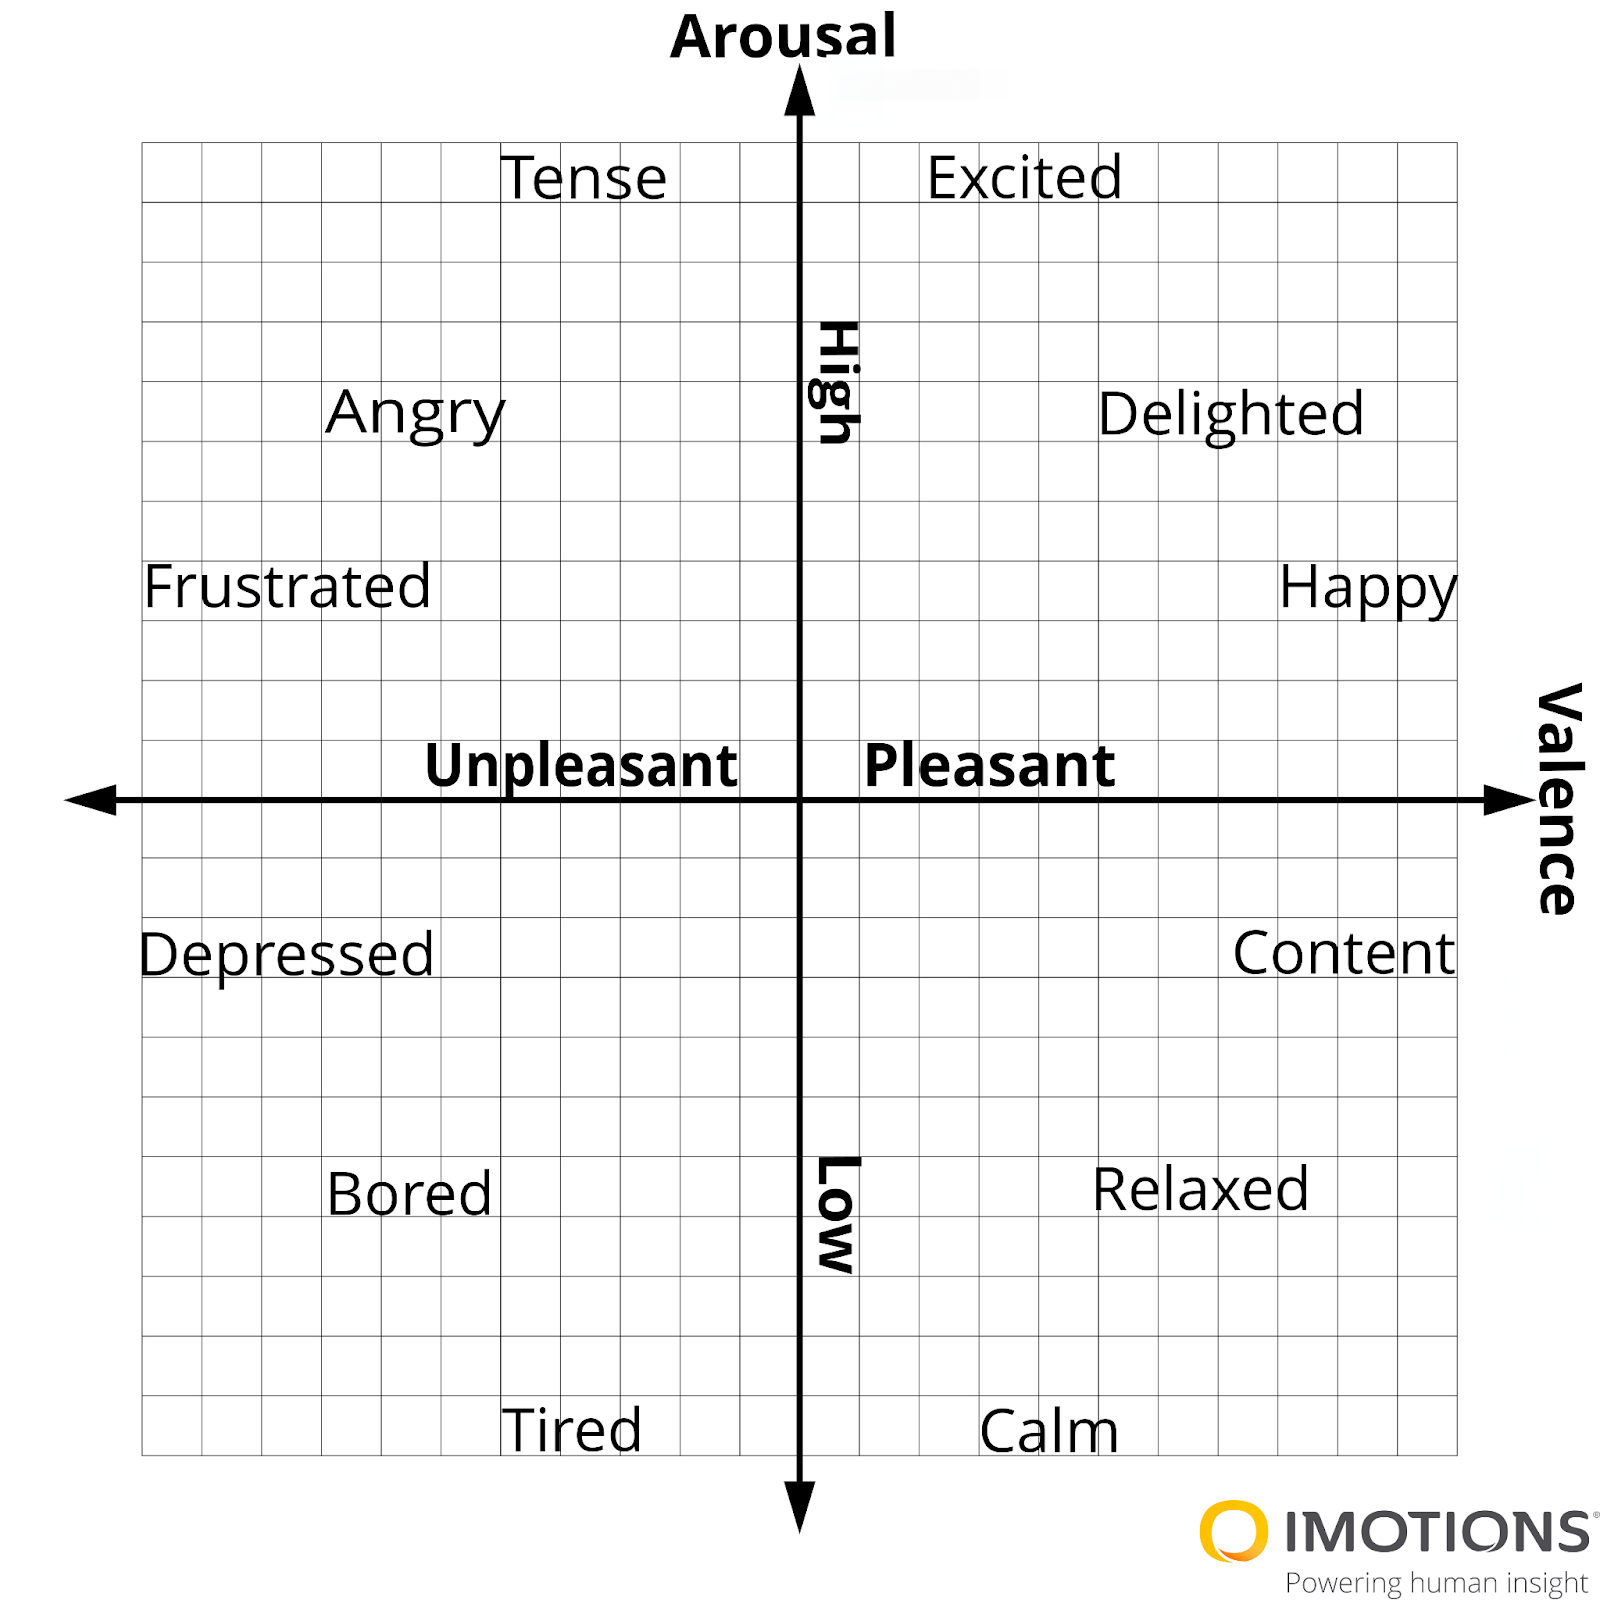
By cross-referencing the data points from these two axes, researchers are able to get a better understanding of a consumer’s emotional state when engaging with a product, allowing them to predict consumer motivation more accurately based on both the intensity and quality of the emotional experience. Done multiple times, emotional valence data can be used effectively to analyze consumer preferences in specific demographics.
Frontal Asymmetry (EEG) as a Marker of Consumer Motivation
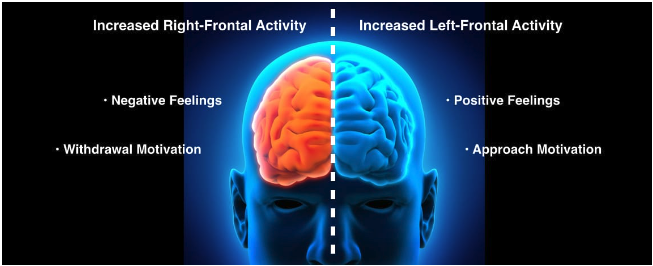
One of the most direct ways of deciphering consumer motivation is through what is called Frontal Asymmetry. Frontal Asymmetry is essentially the analysis of differences in activity between the right and left side of a person’s frontal regions of the brain. That is the area of the brain linked to emotional and motivational processes. That is because the right and left areas of the frontal regions are the areas that process our “approach” or “avoidance” instincts. Specifically when the brain is showing greater engagement in the left frontal cortex, it is associated with positive emotions and a higher likelihood of “approach” behavior, meaning, of course, that we like something.
EEG and Frequency Bands: Measuring Engagement
In EEG studies of frontal asymmetry, various frequency bands are used to assess the activity of a brain. In Frontal Asymmetry studies, the alpha band (8-12 Hz) is of particular interest. Frontal alpha asymmetry, that is the asymmetry between the alpha power of the left and right hemisphere on the frontal regions is linked to approach-avoidance factors of motivation. In other words, higher frontal alpha asymmetry is linked to more approach motivation, that is, a tendency to continue interaction with the stimuli/product at hand.
To read more about how to actually conduct studies with Frontal Asymmetry, check out this article on the subject:

Frontal Asymmetry is a product developers best friend
By measuring the frontal asymmetry of consumers in response to different products or advertisements, companies can gain an unfiltered glimpse into the underlying motivations that drive consumer behavior and decision-making. This method goes beyond self-reported data, which can be biased or inaccurate, providing a more direct and reliable measure of consumer sentiment.
Moreover, the approach-avoidance index derived from frontal asymmetry can help businesses create more engaging offerings to align with the emotional and motivational states of their target audience. For instance, if a particular advertisement sparks greater left-frontal alpha activity in a test group, it stands to reason that it may be more likely to succeed in the broader market. Conversely, if right-frontal alpha activity dominates, the advertisement may need to be revised to avoid negative associations and encourage a more positive response.
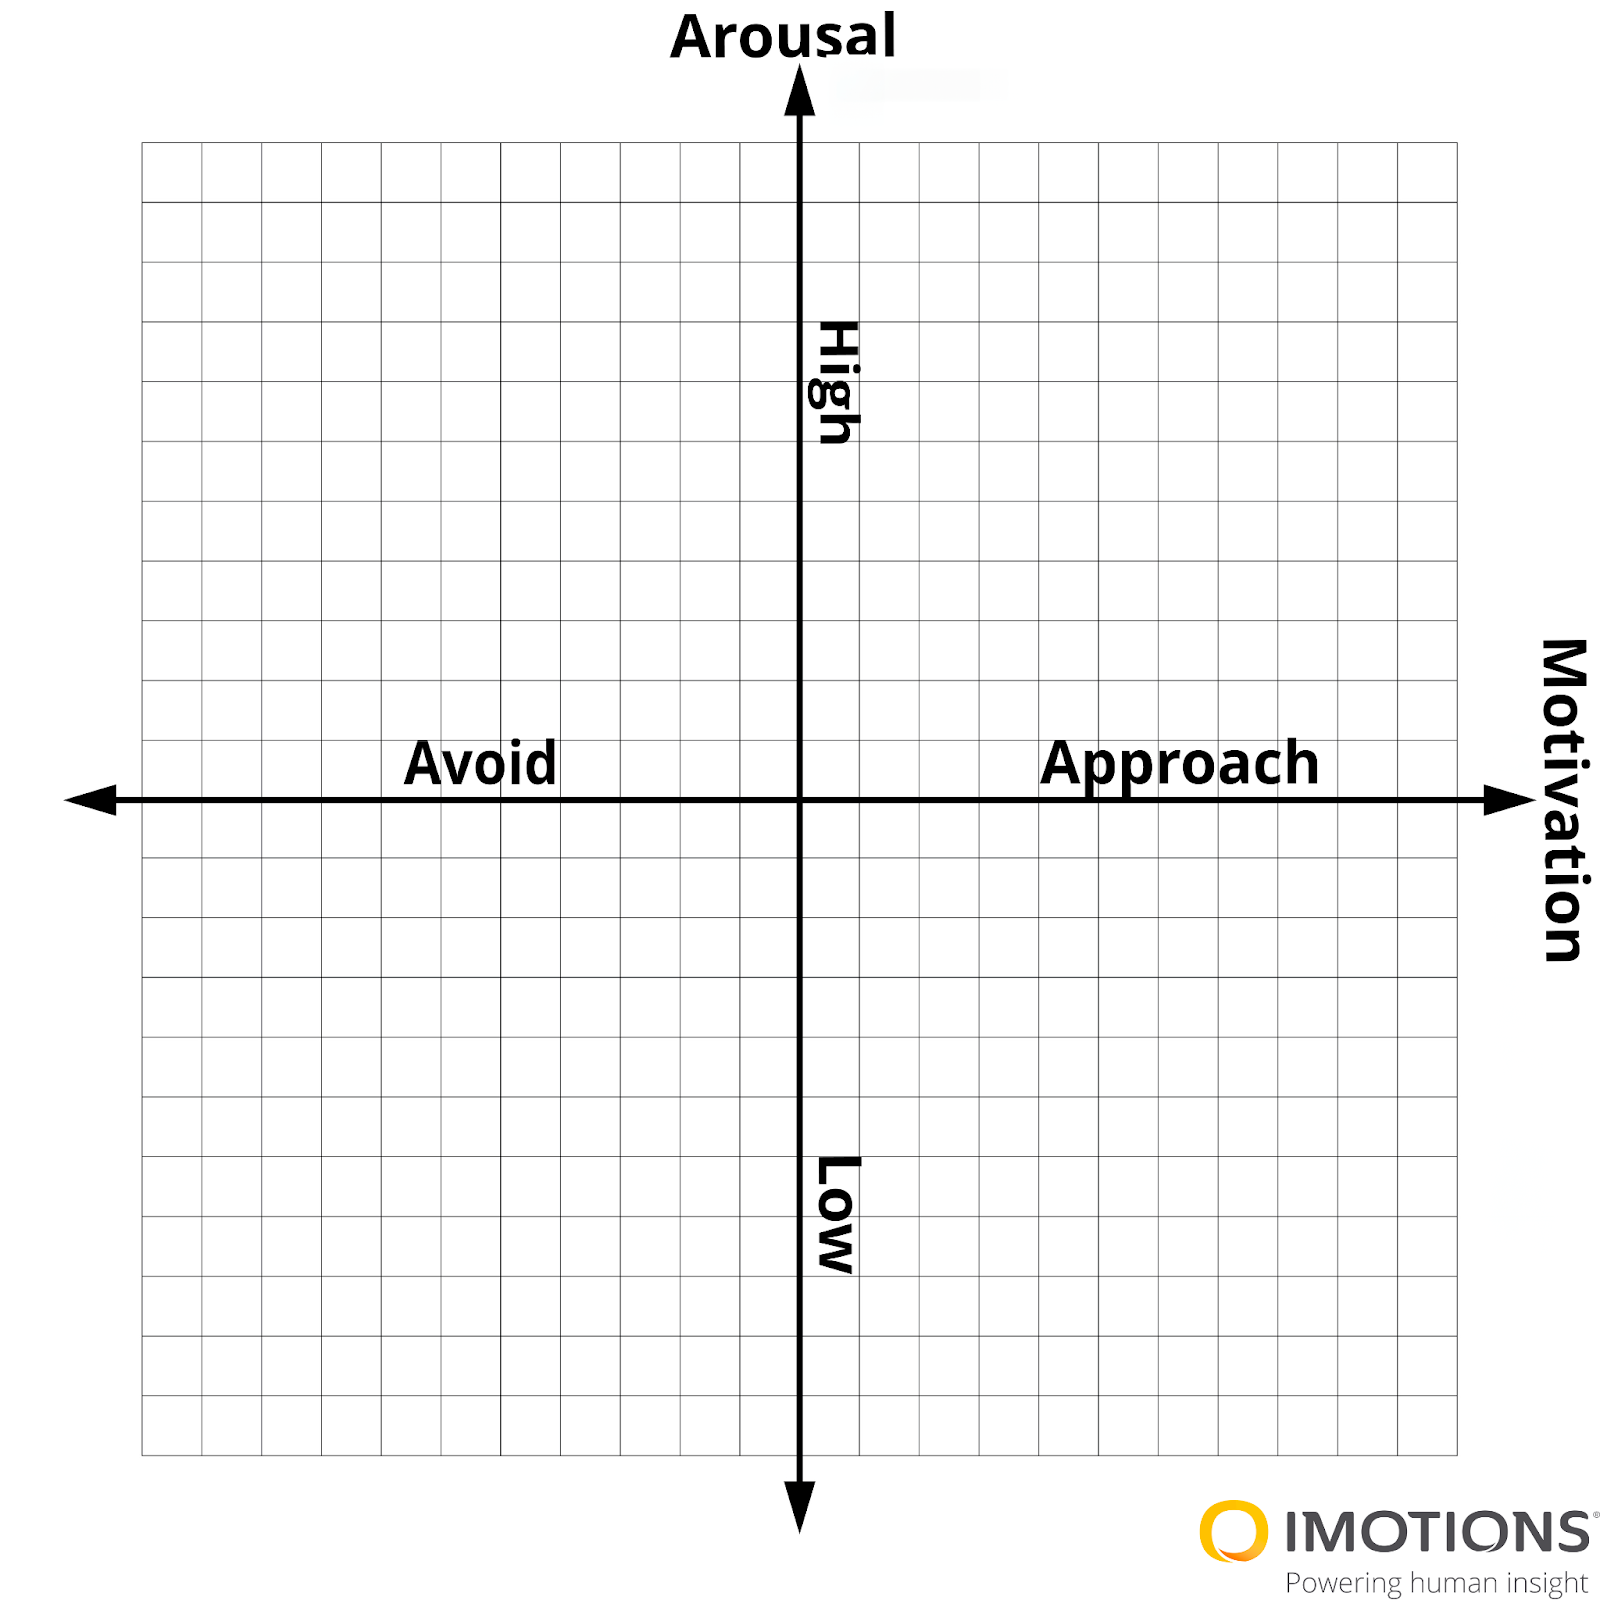
We can modify our Arousal/Valence X/Y graph from earlier to measure and score motivation (instead of valence) and arousal. This can be easily plotted using the circumplex, with FAA on the y-axis giving you a score for motivation and, as earlier, GSR on the x-axis providing a score for arousal. This could tell you if your consumers are more likely to continue engaging with or avoiding stimuli that they find more or less arousing.
How to Use Voice Analysis to Gauge Emotional Valence and Motivation!
There is one avenue of data collection that can give researchers both valence, arousal and motivation in one go, and that is Voice Analysis. When used in iMotions Lab, Voice Analysis offers an extensive avenue for data collection that captures not only the dimensional measures of emotion, such as valence and arousal, but also provides deeper insights through prosody measures and easily categorized emotional states.

Prosody Measures: Unveiling Emotional Cues
Beyond the dimensional measures, voice analysis can delve deeper into the nuances of speech through prosody- the rhythm, stress, and intonation of speech. Prosody offers a more granular view of emotional expression:
- Pitch Variation: Fluctuations in pitch can indicate subtle shifts in emotional states. For example, a rising pitch might suggest a question or uncertainty, while a steady pitch could convey confidence or calmness.
- Speech Rate: Changes in how quickly someone speaks can reveal emotional states. An accelerated speech rate might indicate excitement or nervousness, while a slower rate could suggest sadness or thoughtfulness.
- Pauses and Hesitations: The presence and length of pauses can signal emotional states such as anxiety or uncertainty. Conversely, a smooth and uninterrupted flow of speech might indicate confidence and clarity.
These prosody measures enrich the understanding of a speaker’s emotional state, providing insights that go beyond simple valence and arousal assessments.
Free 52-page Human Behavior Guide
For Beginners and Intermediates
- Get accessible and comprehensive walkthrough
- Valuable human behavior research insight
- Learn how to take your research to the next level