
Diagnosis is where medicine begins. Getting the right diagnosis quickly and easily is a central goal of medical science for obvious reasons: it benefits the patient by ensuring the right care is given as soon as possible, and saves time for the diagnostician, allowing them to attend to more patients.
Medical diagnosis is also a costly affair, with around 10% of all medical costs being dedicated to diagnosis, a number that will continue to grow in the coming years. Finding ways to increase the ease, accessibility, and affordability of reliable medical tests is clearly a worthwhile goal to pursue.
There are several approaches to improving diagnostics, but one of the leading drivers of change in this area is technology. As Harezlak and Kasprowski state in a recent article: “The performance and quality of medical procedures and treatments are inextricably linked to technological development” [1]. Similar to many fields, the more technology can do, the more we can do.
Technological progress has afforded advancement not only in tools’ design and specifications, but also in the software within them. This has created a perfect opportunity for new technological advances to help reduce the burden of diagnostic work. While much research remains to be done, there are signs of how such devices as eye trackers, EEG, EMG, and ECG can contribute to the early detection of diseases and disorders.
Below, we go through some of the ways in which these technologies can be applied to improve both diagnostic accuracy and availability. The focus below is primarily on how future research could robustly identify biomarkers of neurological diseases or psychiatric disorders, as diagnosis is often more undefined in these cases, compared to other diseases in which a cause has been directly identified.
Eye Tracking
One of the first studies using an eye tracker in a medical diagnosis context took place over a hundred years ago, in 1908 [2]. Using the “Dodge Photochronograph” – a method of photographing the reflection of the cornea – the eye movements in response to viewing numerals was recorded. It was found, albeit inconsistently, that schizophrenic eye velocity differed to non-schizophrenic controls.
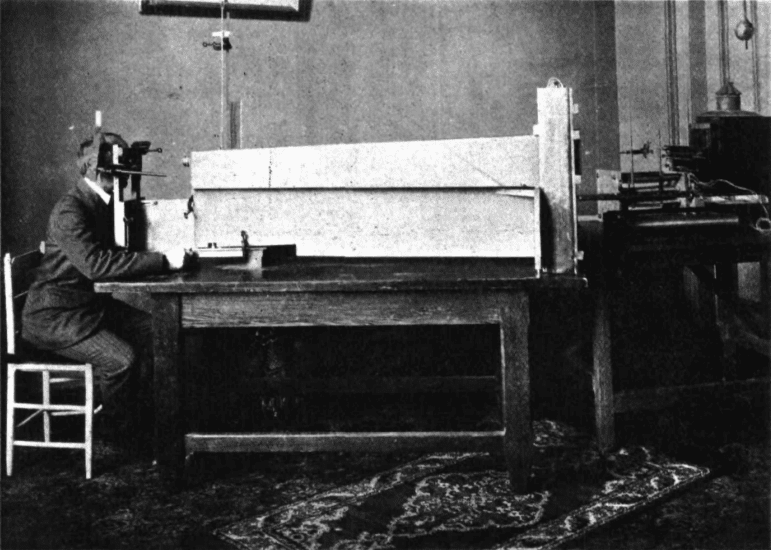
Diefendorf and Dodge, 1908.
The ease-of-use, accuracy, and affordability of eye trackers has since improved rather dramatically in the time since then.
Eye tracking has revealed significant differences between control populations and people with schizophrenia [3], bipolar disorder [4], mild cognitive impairment (MCI)[5], Alzheimer’s disease [6], multiple sclerosis [7], Autism [8, 9], Parkinson’s disease [10], and ADHD [10, 11].
There are several experimental paradigms that are typically used to determine visual behavior with eye trackers. One of the most common approaches are pro- and anti-saccade tasks.
Pro-saccade tasks are relatively straightforward – typically involving the participant staring at a central fixation point on a screen, and then visually attending to a stimulus when it appears. Increases in latencies (slower reaction times) have been found with people with Parkinson’s disease, relative to people without a Parkinson disease diagnosis [10].
Anti-saccade tasks are similar, but the participant is instructed to look in the opposite direction to the stimulus when it appears. This approach has shown significant differences with people with MCI (a likely precursor to Alzheimer’s disease [12]), who exhibit longer latencies when looking in the required direction, and are more likely to make errors [13].
It’s easy to imagine – with the relative affordability, non-invasiveness, and simple task setups – that eye tracking tests could be readily implemented to quickly test for a range of diseases that have an impact on visual behavior.
EEG
There are no shortage of studies showing a link between EEG (electroencephalography) activity and epilepsy [14], Alzheimer’s disease [15], autism [16], ADHD [17], schizophrenia [18], bipolar disorder [19], obsessive compulsive disorder [20], and even Creutzfeldt–Jakob disease [21], among others [22].
Many of these diseases have, as stated above, been found to have an impact on visual behavior, as assessed by eye tracking. Further research could benefit from investigating these potentially associated findings.
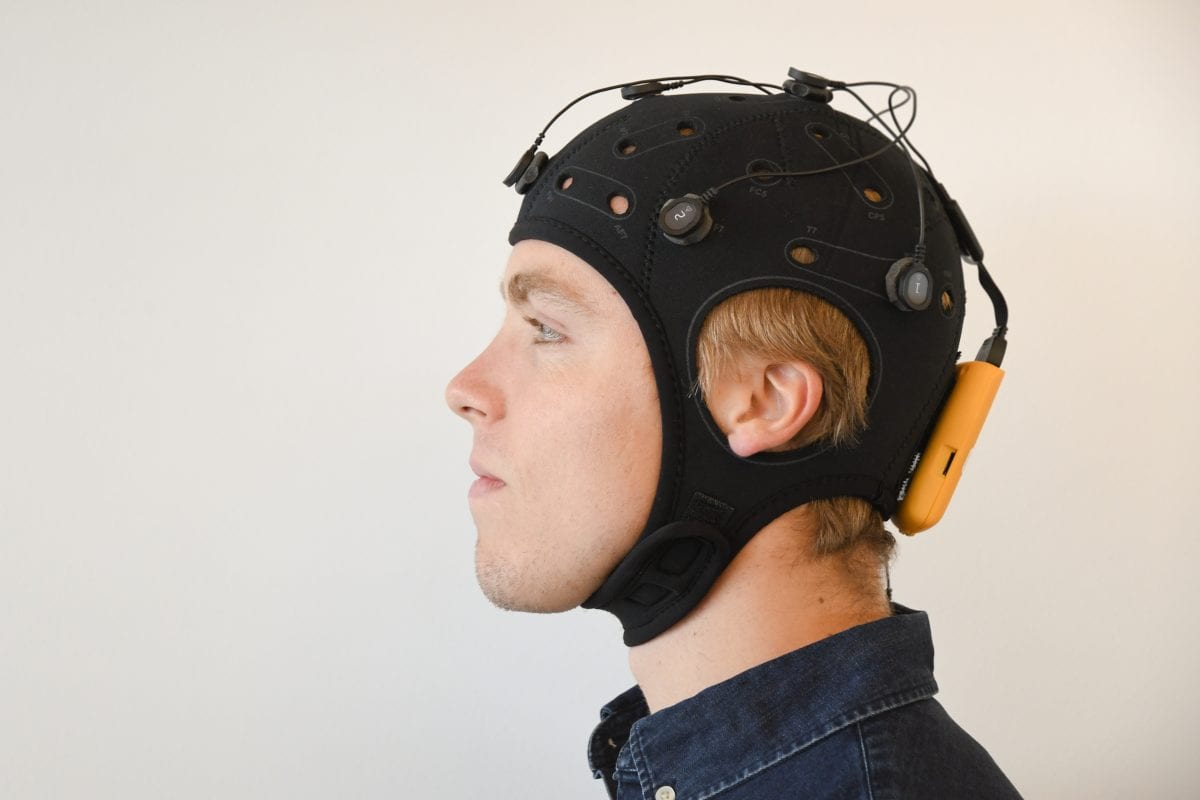
It is perhaps no surprise that EEG, as a direct method of measuring brain activity, is a suitable tool for investigating neurological diseases and disorders. However, the robustness of some of the EEG findings is sometimes called into question in the associated articles. It appears that other methods used conjunctively, and further research in general, may help provide more clarity.
While EEG requires some work when setting up (with determining the correct position of the electrodes, application of gel, checking impedance, etc) the ease of setting up such a system has improved over the years. Further to this, the current widespread application of EEG in medical contexts means that the systems and training are already in place to utilize this technology further in diagnostic contexts where needed.
EMG
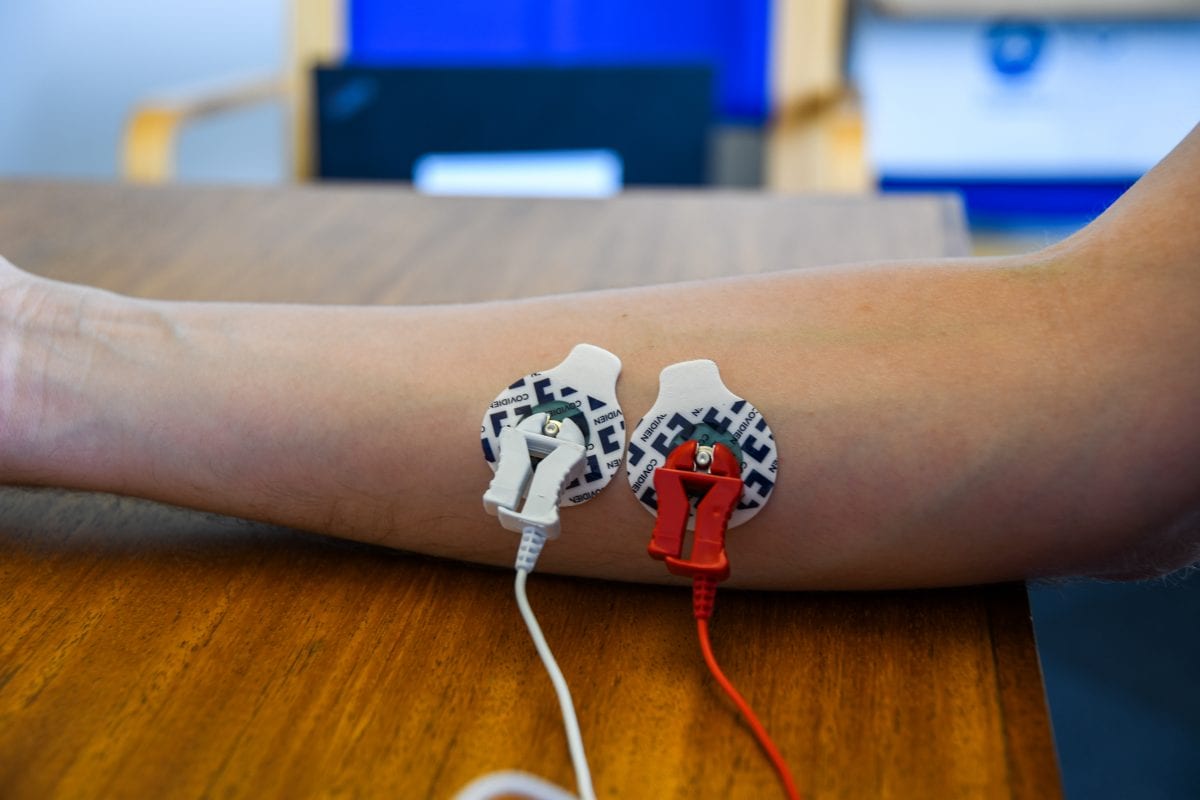
As a method of measuring muscular activity, research with EMG (electromyography) has of course uncovered links between a variety of diseases that affect muscle development and function (e.g. Pompe disease [23]). There are signs however that EMG can also even be used as an indicator of some neurological diseases.
Research has shown significant differences in EMG recordings between patients with Parkinson’s disease [24], and Huntington’s disease [25], both of which are progressive degenerative disorders that primarily affect the brain (although not exclusively – a muscular component is present in both disorders). Future research may yet yield associations with abnormal EMG recordings and disease, offering yet another route to diagnosis.
EMG devices, while both non-invasive and often portable, do require some work to get them set up (with both skin preparation and the recording of a baseline of muscular activity), yet as with EEG these devices are already readily applied in a clinical context.
Facial Expression Analysis
The generation of facial expressions is often an automatic, non-conscious process, yet can also be brought under conscious control. Differences in the ability to produce facial expressions has been found with individuals with autism [31].
Facial expression analysis is also widely discussed in the context of training for individual with autism to improve social capabilities [32]. While not directly related to diagnosis of autism, the findings yielded from such a system could help further an understanding of how autism develops.
Researchers have suggested a methodology using automated facial expression analysis to identify characteristics of schizophrenia [33]. Schizophrenia is often associated with impaired emotion expression or flat affect, ultimately meaning that their exhibited facial expressions may differ when compared to non-schizophrenic controls. The researchers find that the system can identify significant differences between such populations, and could be developed further as a supportive tool in diagnostics.
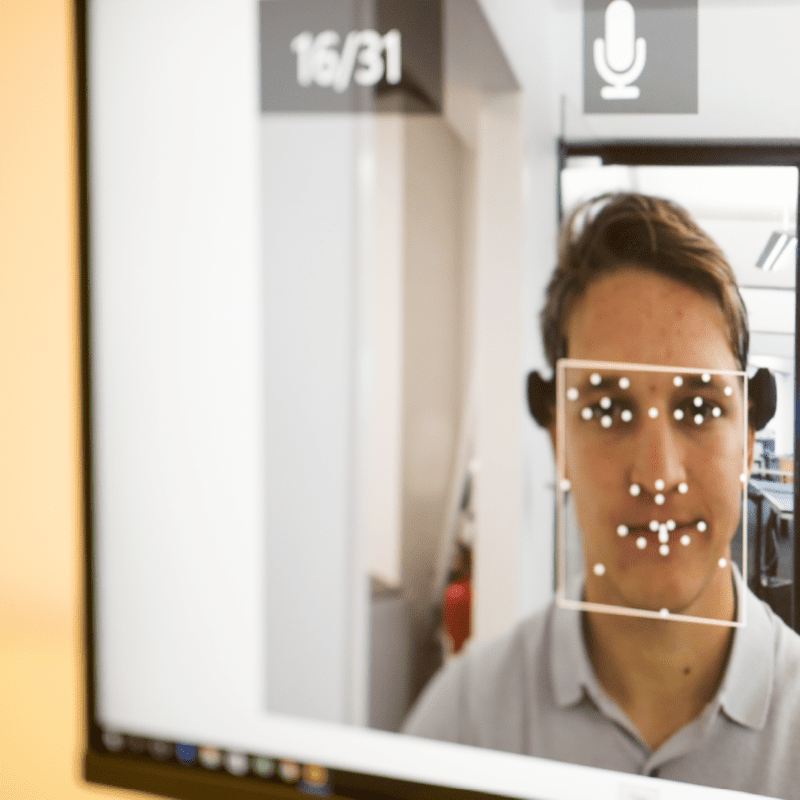
The completely unobtrusive nature of automated facial expression analysis means that it can be applied without causing any discomfort to patients. While further research will be required to clearly define potential connections to autism or psychiatric disorders, the ease-of-use means that this methodology could be readily applied in a clinical context.
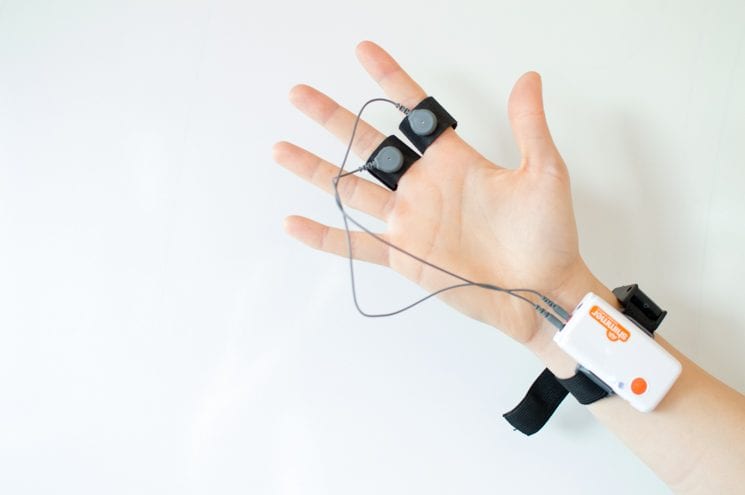
Galvanic Skin Response
GSR (galvanic skin response), otherwise known as EDA (electrodermal activity) is a measure of sweat gland activity, often (but not exclusively) measured from the fingers. This method is easily applied and the devices can be portable, allowing for naturalistic collection of data.
Associations have also been (as with facial expression analysis) found with schizophrenia, although with inconsistencies potentially related to diagnostic classifications [27, 28]. Further research may help determine how and if GSR / EDA can provide any useful information in schizophrenia diagnoses.
Significant associations have been found with the level of stress that an individual is experiencing (alongside heart rate as collected by ECG [26]). While not a psychiatric disorder, this may be relevant information to collect within a clinical context.
Similarly inconsistent results have also been found with GSR / EDA as an indicator of autism [29], yet work continues in large-scale research projects in order to identify reliable and implementable biomarkers [30]. The JAKE research project (which we have discussed before) could help provide further insight into the findings from EEG, facial expression analysis, GSR, and eye tracking data, and how each relates to autism.
GSR / EDA devices are easily applied, relatively cheap, and can be worn as a portable device with little interference to regular movement. This could allow for ambulatory and naturalistic collection of data for further investigation into potential links into psychiatric disorders.
Conclusion
A central benefit to these devices is that the data from each can be collected simultaneously. With the rise of machine learning methods to complex datasets, it is easy to imagine that analyses could pave the way for a more automated assessment of a range of potential diseases or disorders.
Combining these methods could further bolster the reliability of each result (e.g. analysis of EEG and eye tracking data to provide an early diagnosis of children with autism, of which preliminary results suggest could be worthwhile [34]).
The above studies represent just some of the cases in which potential links have been found in relation to the data collected from these devices and neurological diseases or disorders. While in many cases further studies are required to provide definitive biomarkers, the trajectory of current research clearly shows that this is the direction we’re heading.
I hope you’ve enjoyed reading about how a variety of different sensors can give insights into neurological diseases and psychiatric disorders. Click here to learn more about how iMotions can help develop an understanding of issues within medical / healthcare research.
References
[1] Harezlak, K., Kasprowski P. (2018). Application of eye tracking in medicine: a survey, research issues and challenges. Computerized Medical Imaging and Graphics. Apr; 65:176-190.
[2] Diefendorf, A. R., Dodge, R. (1908). An Experimental Study of the Ocular Reactions of the Insane from Photographic Records. Brain, Volume 31, Issue 3, 1, 451–489, Https://Doi.Org/10.1093/Brain/31.3.451
[3] Arolt, V., Lencer, R., Nolte, A., Müller-Myhsok, B., Purmann, S., Schürmann M., et al. (1996). Eye tracking dysfunction is a putative phenotypic susceptibility marker of schizophrenia and maps to a locus on chromosome 6p in families with multiple occurrence of the disease. Am. J. Med. Genet. 67564–579.
[4] Garcıa-Blanco, A., Salmerón, L., Perea, M., Livianos, L. (2014). Attentional biases toward emotional images in the different episodes of bipolar disorder: an eye-tracking study. Psychiatry Res. 215 (3), 628–633.
[5] Yang, Q., Wang, T., Su, N., Xiao, S., Kapoula, Z. (2013). Specific saccade deficits in patients with Alzheimer’s disease at mild to moderate stage and in patients with amnestic mild cognitive impairment. Age. 35 (4), 1287–1298.
[6] Crutcher, M. D., Calhoun-Haney, R., Manzanares, C. M., Lah, J. J., Levey, A. I., Zola, S. M. (2009). Eye tracking during a visual paired comparison task as a predictor of early dementia. Am. J. Alzheimer’s Dis. Other Dementias.
[7] Derwenskus, J., Rucker, J.C., Serra, A., Stahl, J. S., Downey, D. L., Adams, N. L., Leigh, R. (2005). Abnormal eye movements predict disability in ms: two-year follow-up. Ann. N. Y. Acad. Sci. 1039 (1), 521–523.
[8] Wang, S., Jiang, M., Duchesne, X.M., Laugeson, E.A., Kennedy, D.P., Adolphs, R.,Zhao, Q. (2015). Atypical visual saliency in autism spectrum disorder quantified through model-based eye tracking. Neuron. 88 (3), 604–616.
[9] Jones, W., Carr, K., Klin, A. (2008). Absence of preferential looking to the eyes of approaching adults predicts level of social disability in 2-year-old toddlers with autism spectrum disorder. Arch. Gen. Psychiatry. 65 946–954. 10.1001/archpsyc.65.8.946
[10] Tseng, P.-H., Cameron, I. G., Pari, G., Reynolds, J. N., Munoz, D. P., Itti, L. (2013). High-throughput classification of clinical populations from natural viewing eye movements. J. Neurol. 260 (1), 275–284.
[11] Dankner, Y., Shalev, L., Carrasco, M., Yuval-Greenberg, S. (2017). Prestimulus inhibition of saccades in adults with and without attention-deficit / hyperactivity disorder as an index of temporal expectations. Psychological Science. 28(7), 835–850.
[12] Petersen, R. (2009). Early diagnosis of Alzheimer’s disease: is MCI too late? Current Alzheimer Research. 6(4):324–330. doi: 10.2174/156720509788929237.
[13] Pereira, M. L., Camargo, M., Aprahamian, I., Forlenza, O. V. (2014). Eye movement analysis and cognitive processing: detecting indicators of conversion to Alzheimer’s disease. Neuropsychiatr Dis Treat. 10:1273–1285. doi: 10.2147/NDT.S55371.
[14] Mormann, F., Kreuz, T. H., Rieke, C. H., Andrzejak. R. G., Kraskov, A., David, P., Elger, C. E., Lehnertz, K. (2005). On the predictability of epileptic seizures. Clin Neurophysiol. 116:569–97.
[15] Kowalski, J. W., Gawel, M., Pfeffer, A., Barcikowska, M. (2001). The diagnostic value of EEG in Alzheimer disease: correlation with the severity of mental impairment. Journal of Clinical. Neurophysiology. 18(6): 570–575.
[16] Cociu, B. A., Das, S., Billeci, L., Jamal, W., Maharatna, K., Calderoni, S., Narzisi, A., Muratori, F. (2017). Multimodal functional and structural brain connectivity analysis in autism: A preliminary integrated approach with EEG fMRI and DTI. IEEE Trans. Cogn. Develop. Syst. 10, 2, 213-226. DOI: 10.1109/TCDS.2017.2680408.
[17] Arns, M., Conners, C. K., Kraemer, H. C. (2013). A decade of EEG theta/beta ratio research in ADHD: a meta-analysis. J. Atten. Disord. 17, 374–383. 10.1177/1087054712460087.
[18] Boutros, N. N., Arfken,C., Galderisi, S.,Warrick, J., Pratt, G., Iacono, W. (2008). The status of spectral EEG abnormality as a diagnostic test for schizophrenia. Schizophr. Res. 99, 225–237.
[19] Kam, J. W., Bolbecker, A. R., O’Donnell, B. F., Hetrick, W. P., Brenner, C. A. (2013). Resting state EEG power and coherence abnormalities in bipolar disorder and schizophrenia. J Psychiatr Res. 47:1893–901. doi: 10.1016/j.jpsychires.2013.09.009.
[20] Velikova, S., Locatelli, M., Insacco, C., Smeraldi, E., Comi, G., Leocani, L. (2010). Dysfunctional brain circuitry in obsessive-compulsive disorder: source and coherence analysis of EEG rhythms. Neuroimage. 49(1):977–983.
[21] Zerr, I., Pocchiari, M., Collins, S., Brandel, J. P., de Pedro, C. J., Knight, R. S., et al. (2000). Analysis of EEG and CSF 14-3-3 proteins as aids to the diagnosis of Creutzfeldt-Jakob disease. Neurology. 55:811–815. doi: 10.1212/WNL.55.6.811.
[22] Herrmann, C., Demiralp, T. (2005). Human EEG gamma oscillations in neuropsychiatric disorders. Clin. Neurophysiol. 116, 2719–2733. doi: 10.1016/j.clinph.2005.07.007
[23] Kishnani, P. S., Steiner, R. D., Bali, D., Berger, K., Byrne, B. J., Case, L., Crowley, J. F., Downs, S., Howell, R. R., Kravitz, R. M., Mackey, J., Marsden, D., Martins, A. M., Millington, D. S., Nicolino, M., O’Grady, G., Patterson, M. C., Rapoport, D. M., Slonim, A., Spencer, C. T., Tifft, C. J., Watson, M. S. (2006). Pompe disease diagnosis and management guideline. Genet Med. 8:267–288. doi: 10.1097/01.gim.0000218152.87434.f3.
[24] Vitale, C., Marcelli, V., Furia, T., et al. (2011). Vestibular impairment and adaptive postural imbalance in parkinsonian patients with lateral trunk flexion. Mov Disord. 26:1458-1463.
[25] Swerdlow, N. R., Paulsen, J., Braff, D. L., et al. (1995). Impaired prepulse inhibition of acoustic and tactile startle response in patients with Huntington’s disease. J. Neurol. Neurosurg. Psychiatry. 58, 192–200.
[26] Tulen, J. H. M., Moleman, P., Van Steenis, H. G., Boomsma F. (1989). Characterization of stress reactions to the Stroop Color Word Test. Pharmacol. Biochem. Behav. 32 9–15. 10.1016/0091-3057(89)90204-9.
[27] Öhman, A. (1981). Electrodermal activity and vulnerability to schizophrenia: a review. Biol. Psychol.12, 87–145. 10.1016/0301-0511(81)90008-9.
[28] Zahn, T. P., Frith, C. D., Steinhauer, S. R. (1991). Autonomic functioning in schizophrenia: Electrodermal activity, heart rate, pupillography. In S.R. Steinhauer. J. H. Gruzelier, & J. Zubin (Eds.), Handbook of schizophrenia: Vol. 5. Neuropsychology. psychophysiology, and information processing (pp. 185—224 ). Amsterdam: Elsevier.
[29] Hirstein, W., Iversen, P., Ramachandran, V. S. (2001). Autonomic responses of autistic children to people and objects. Proc Biol Sci. 268(1479):1883–8.
[30] Ness, S. L., Manyakov, N. V., Bangerter, A., et al. (2017). JAKE(R) Multimodal Data Capture System: Insights from an Observational Study of Autism Spectrum Disorder. Front Neurosci. 11:517.
[31] Manfredonia, J., Bangerter, A., Manyakov, N. V., Ness, S., Lewin, D., Skalkin, A., Boice, M., Goodwin, M. S., Dawson, G., Hendren, R., Leventhal, B., Shic, F., Pandina, G. (2018). Automatic Recognition of Posed Facial Expression of Emotion in Individuals with Autism Spectrum Disorder. J Autism Dev Disord. Oct 8. doi: 10.1007/s10803-018-3757-9.
[32] Liu, R., Salisbury, J. P., Vahabzadeh, A., Sahin, N. T. (2017). Feasibility of an Autism-Focused Augmented Reality Smart glasses System for Social Communication and Behavioral Coaching. Front. Pediatr. 5:145. doi: 10.3389/fped.2017.00145.
[33] Wang, P., Barrett, F., Martin, E., Miloncva, M., Gur, R. E., Gur, R. C., et al. (2008). Automated video-based facial expression analysis of neuropsychiatric disorders. Journal of Neuroscience Methods. 168: 224–238.
[34] Billeci, L., Narzisi, A., Tonacci, A., Sbriscia-Fioretti, B., Serasini, L., Fulceri, F., Apicella, F., Sicca, F., Calderoni, S., Muratori, F. (2017). An integrated eeg and eye-tracking approach for the study of responding and initiating joint attention in autism spectrum disorders. Scientific Reports, 7(1):13560.