

We Power Human Insight
iMotions is the world’s premier provider of human insights software. Across its desktop and online applications, iMotions allow users to collect and analyze human behavior data through eye tracking, galvanic skin response, facial expression analysis, EEG, EMG, and ECG on one convenient platform. Backed by science, this multi-modal software suite is the most comprehensive human insights tool currently available on the market.
What Insights Are You Interested In?
Software

iMotions Software Products
Full-scale human behavior
research solutions
A software research suite that integrates an ecosystem of virtually any biosensor technology to provide the most robust data and insights available.
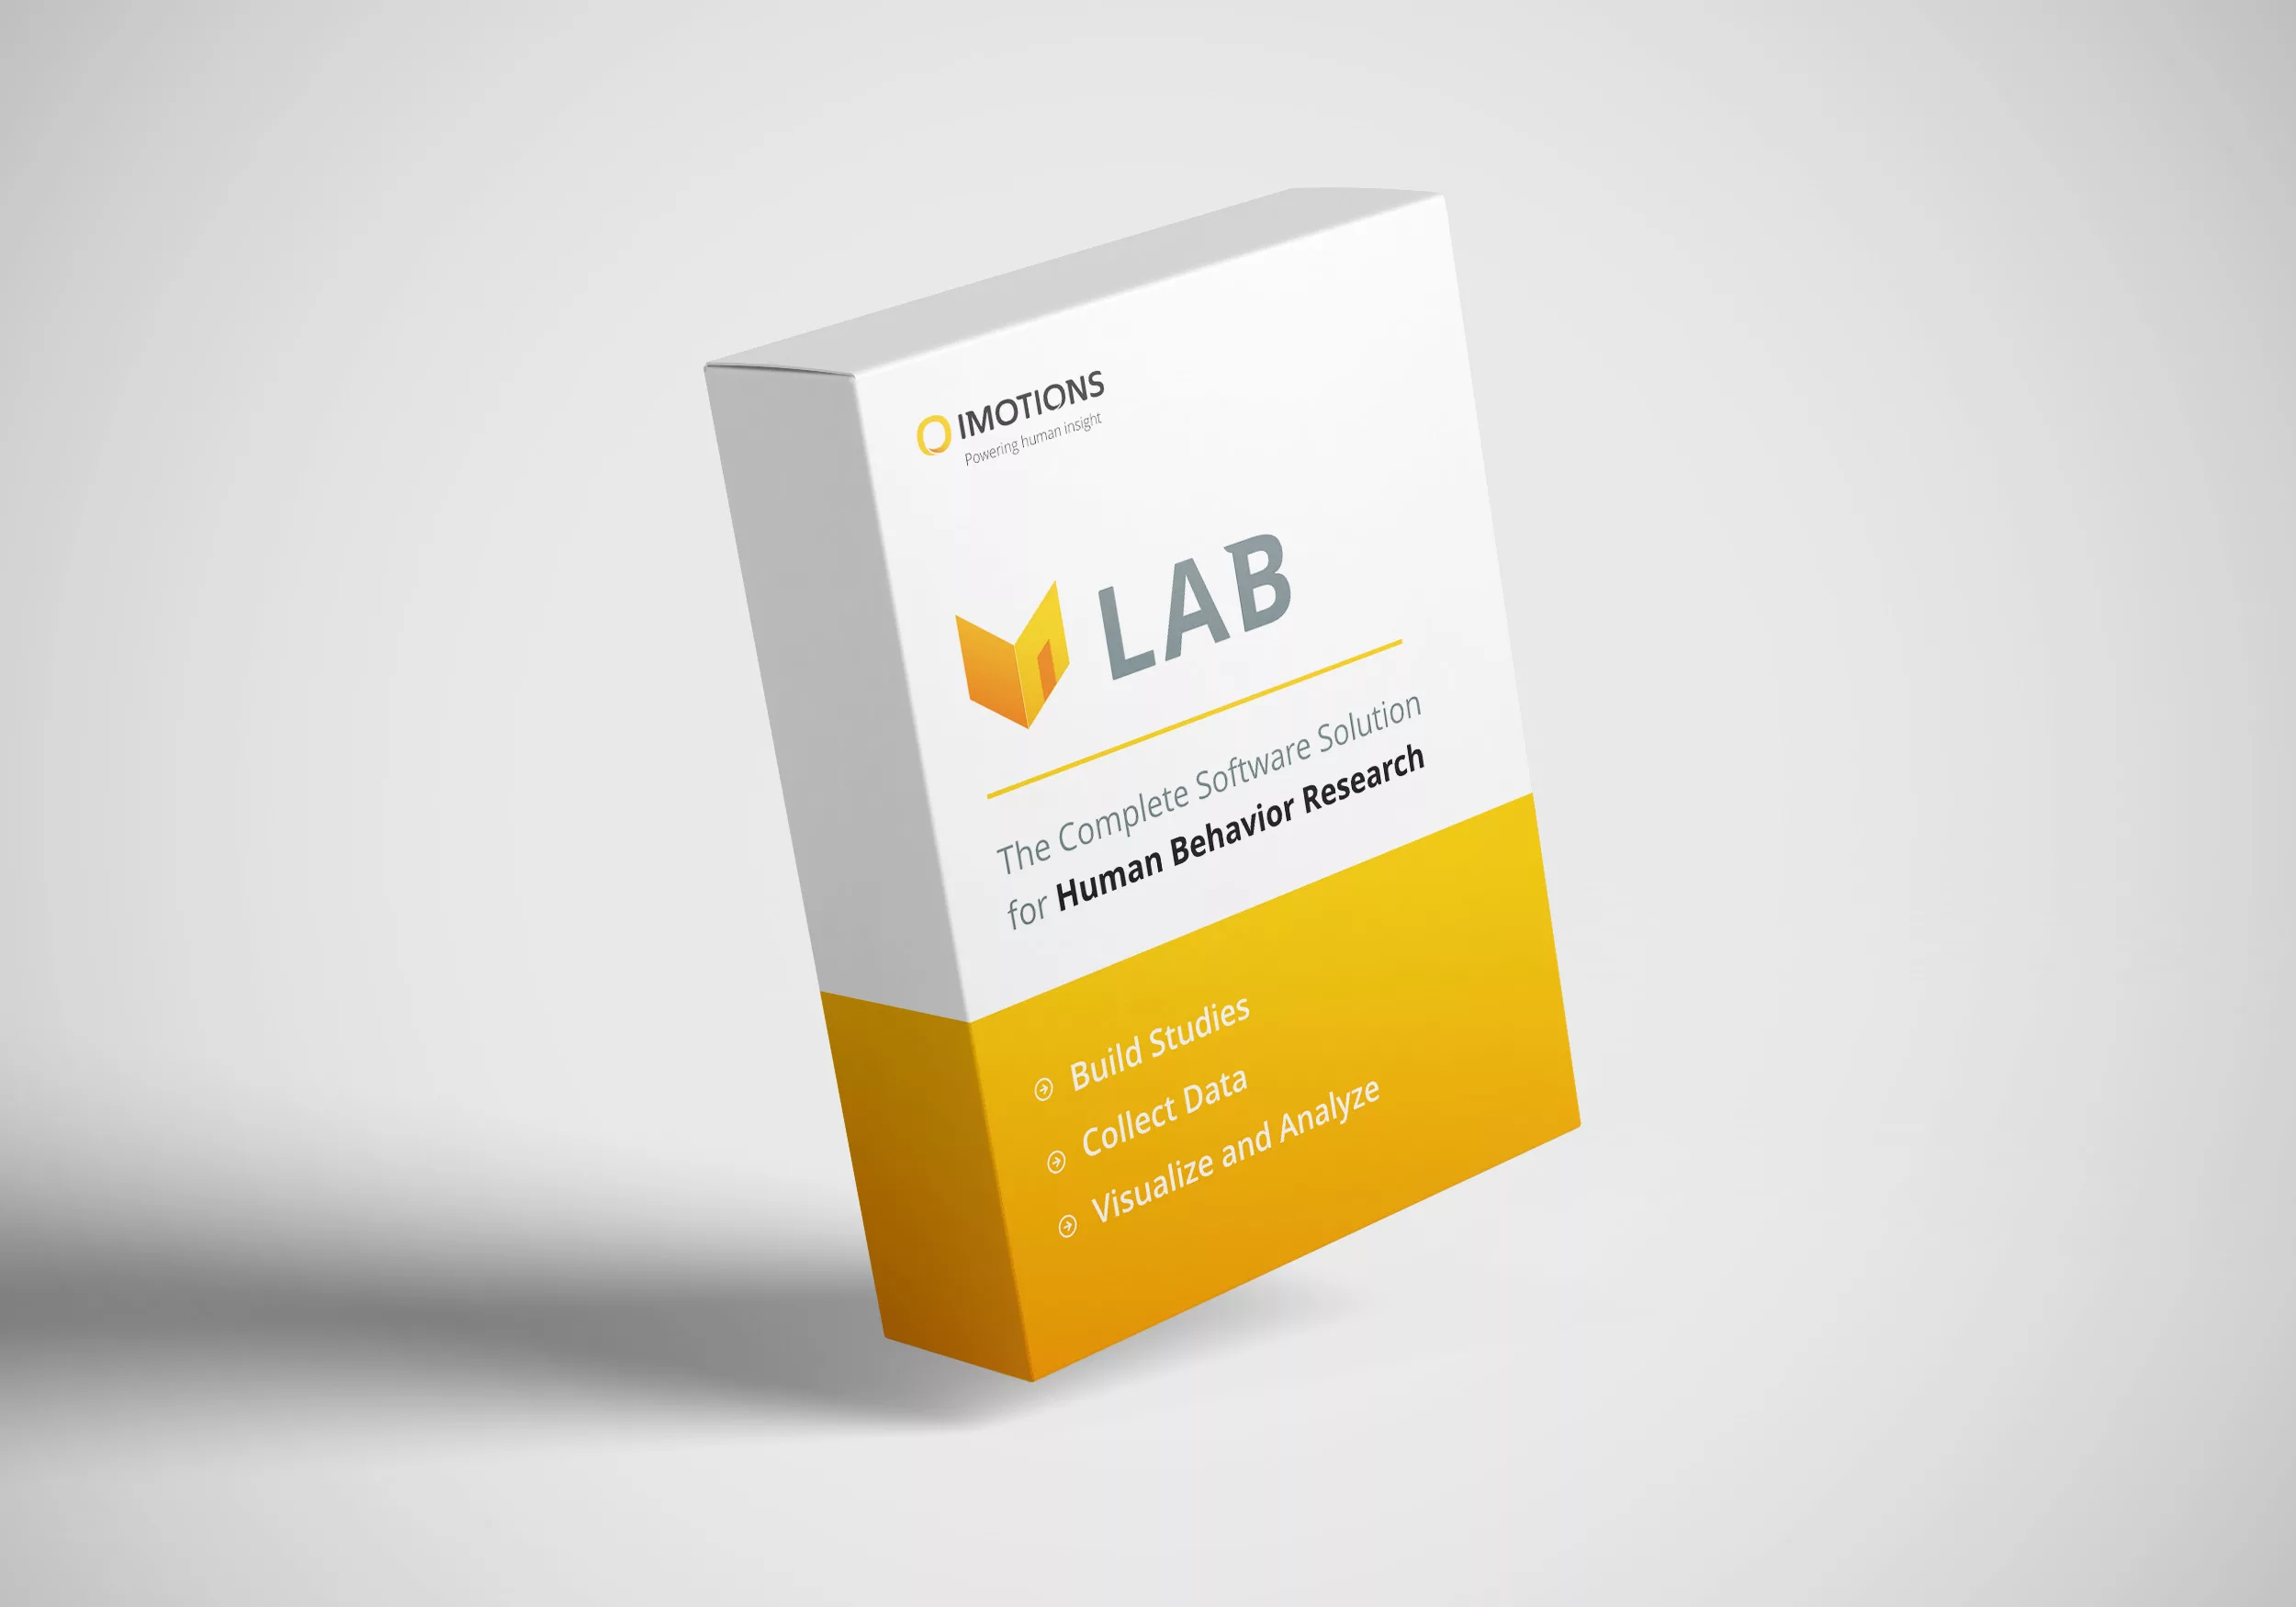
iMotions Lab
Trusted by researchers, iMotions Lab lets you collect and analyze data from biosensors and create studies with any stimuli
iMotions Education
Webcam Eye Tracking and Facial Expression Analysis for deploying studies quickly and easily around the world, supported by all major browsers and ideal for classroom teaching.
-

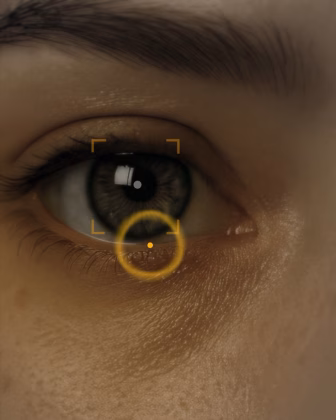
Eye Tracking
Screen Based
-

Eye Tracking VR
Virtual and mixed reality eye tracking
-

Eye Tracking Glasses
Eye tracking using glasses
-
EDA / GSR
Electrodermal Activity
-

EDA / GSR
Electrodermal Activity
-

EMG
Electromyography
-

Respiration
Measure breathing
-

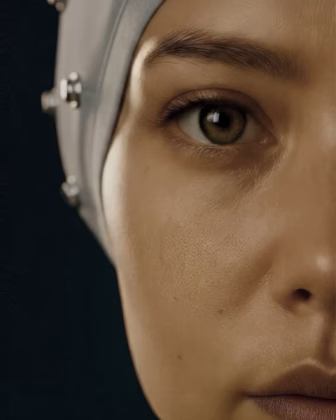
EEG
Electroencephalography
-

fNIRS
Measures brain activity through blood and oxygen changes
-

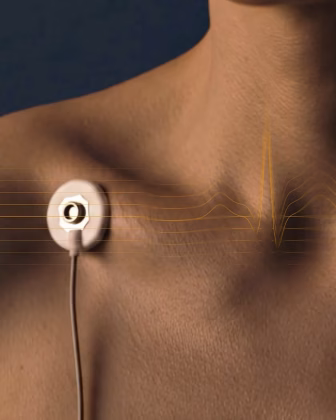
ECG
Electrocardiogram
-

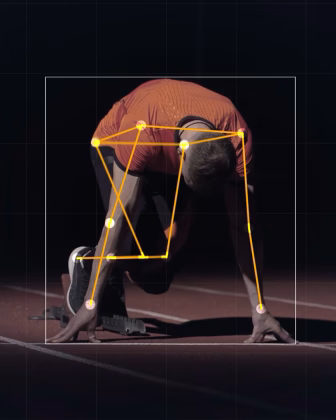
Motion Capture
Track human body kinematics using only video
-

GPS
Track location, movement and speed
-

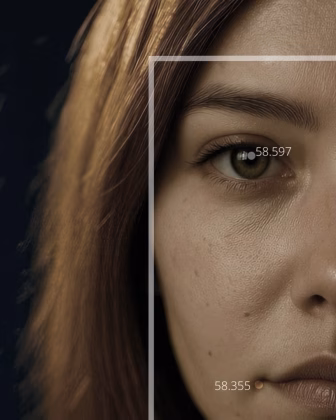
Facial Expression Analysis
Facial Expression Analysis
-

Voice Analysis
Emotion and Voice Characteristics
-

Automated AOI
Automated AOI
-

FEA Multiface
FEA addon for multiface tracking
-

Remote Data Collection
Collect webcam eye tracking, FEA, Respiration and Voice
-

Webcam Eye Tracking
Webcam Eye Tracking
-

Webcam Respiration
Measure breathing via video
Used by leading universities
Used by 9/10 of the 10 highest ranked universities


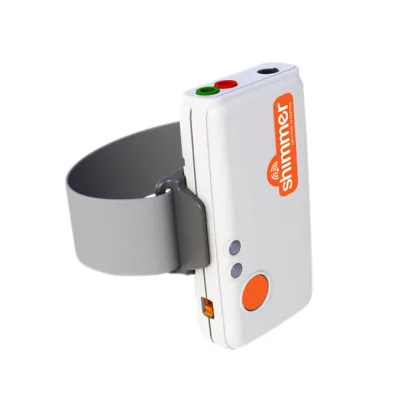
Shop for eye trackers and biosensors
We support and partner with over 20 of the world’s biggest sensor hardware companies.
Start Browsing


Introducing iMotions Selling Partners
Explore our network of selling partners and discover how they can assist you in harnessing the power of our innovative technologies.
We currently have partners covering Latin America, China, Japan, India, South Korea, Poland, and Romania.


iMotions software solutions for
Human Behavior Research
We’ve developed the world’s leading platform for monitoring and analyzing the drivers of human behavior. Given that much of our actions, decision-making, and motivation occurs outside of conscious awareness, we help scientists and businesses understand these hidden factors that lie behind our behavior. We enable you to use the latest neuroscience tools to develop this understanding within an abundance of applications
More than 3/4 of the world’s top 100 universities use our platform.

Consumer Insights
Academia
Browse Customer Stories


News
Inspiration from the blog
-
Tips and Tricks for Using iMotions Lab: Vol. 1
-

Combatting Fraud in Online Surveys: What To Do When Your Respondents Aren’t Real
-

Human-in-the-Loop Digital Twins: How Real-Time Biosensor Data Is Transforming Simulator Research
-

Digital Twins in Consumer Research: Validating Synthetic Behavior with Biosensors
Publications
Read publications made possible with iMotions
Blog
Get inspired and learn more from our expert content writers
Newsletter
A monthly close up of latest product and research news