Drowsiness directly impacts safety, performance, and well‑being. Understanding drowsiness is critical in automotive and transportation safety, workplace and occupational health, aviation, clinical sleep research, consumer health, and human‑factors testing. Research focusing on shift work, (especially night shifts or long shifts) and long-duration tasks (e.g., performing surgeries, flying planes, driving trucks) often investigates drowsiness, sleepiness, fatigue, and alertness.

This article summarizes different ways to use iMotions to investigate drowsiness using physiological sensors including eye tracking, ECG and EEG.
Table of Contents
PERCLOS
PERCLOS (percentage of eyelid closure over time) measures the proportion of time the eyes are closed beyond a threshold (typically, 80%) and is widely used as a behavioral marker of drowsiness. PERCLOS is a reliable, vision‑based indicator of eye closure and reduced vigilance.
PERCLOS Overview
- Popular Industries: automotive/transportation (driver monitoring systems), aviation, heavy machinery, and workplace safety.
- Hardware: eye-tracking glasses, screen-based eye trackers
- Data Analysis Complexity: low–moderate.
- Established algorithms require preprocessing (for face/eye detection and blink filtering) and calibration (for different subjects and lighting).
- iMotions R Notebook includes preprocessing and calibration in relevant eye-tracking modules.
Considerations when using Eye Tracking to measure PERCLOS
Pros: no‑contact necessary with screen-based eye tracking. Easy-to-use hardware with eye-tracking glasses. Works well in‑vehicle, simulator, or workstation monitoring. Data output is easy to understand.
Cons: PERCLOS is sensitive to lighting, occlusions, and camera placement.
Let’s talk!
Schedule a free demo or get a quote to discover how our software and hardware solutions can support your research.
Blink Rate
Blink rate fluctuates with tiredness: longer blinks and increased slow/partial blinks often indicate reduced vigilance or drowsiness.
Blink Rate Overview
- Popular Industries: driver monitoring, workplace safety, usability testing, and consumer health.
- Hardware: eye trackers or web cameras (with facial expression analysis module)
- Data Analysis Complexity: low–moderate.
- detection algorithms are straightforward, but blink rate is also influenced by environmental and cognitive factors, making interpretation challenging.
- iMotions Eye-tracking modules (screen-based, glasses and VR) and the facial expression analysis module give blink rate automatically.
Considerations when using Blink Rate
Pros: easy to measure with cameras, complements PERCLOS, and provides high temporal resolution for short‑term lapses.
Cons: blink metrics are affected by the environment (wind, dry eyes) and cognitive load (not just fatigue).
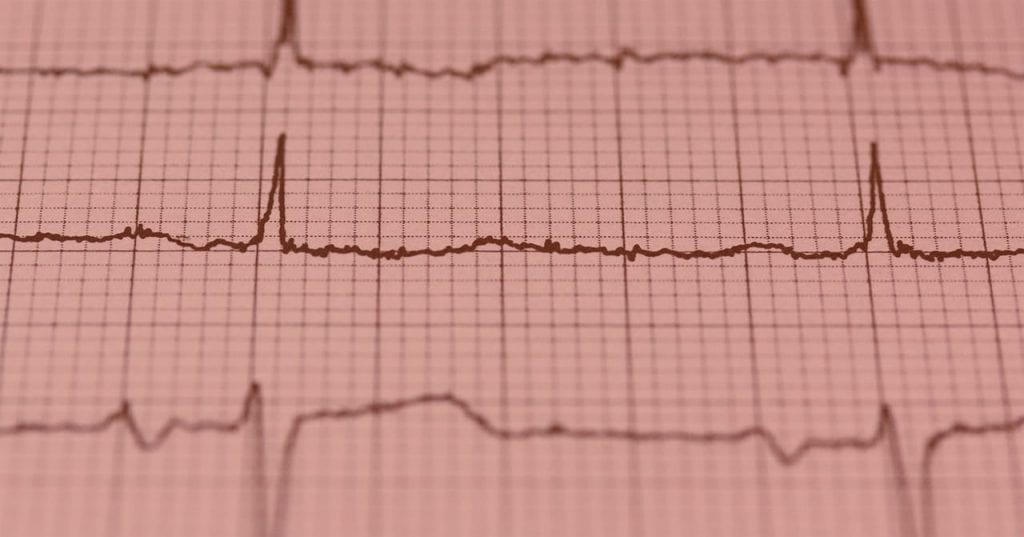
Heart Rate Variability (HRV)
Heart rate variability (HRV) reflects the variation in time between heartbeats (interbeat interval; IBI). HRV is measured with electrocardiography (ECG) and reflects autonomic nervous system activity. More specifically, HRV metrics can be used to understand the balance of the parasympathetic and nonparasympathetic nervous systems. Generally, reductions in certain HRV metrics correlate with fatigue and decreased alertness and vigilance.
For more information on HRV, visit our blog.
Heart Rate Variability Overview
- Popular Industries: clinical research, sleep medicine, occupational health, sports and military applications.
- Hardware: ECG with electrodes, chest straps
- Data Analysis complexity: moderate–high.
- HRV requires robust artifact detection, spectral/time‑domain calculations, and interpretation against baselines.
- With iMotions HRV R Notebook, these calculations are automatic.
Considerations when using ECG to measure Heart Rate Variability
Pros: noninvasive and easily available hardware. Continuous Monitoring. Complements other metrics.
Cons: Low specificity because also influenced by factors such as cognitive load. Reflects slow changes.
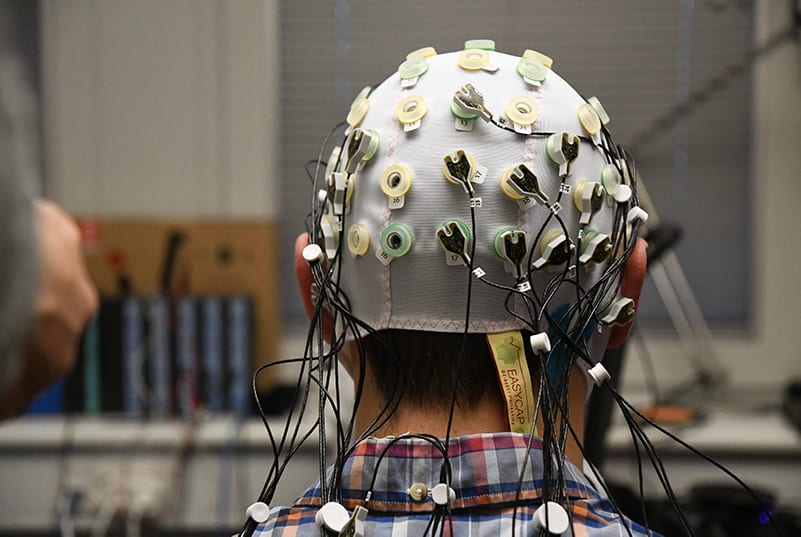
Theta and Delta Power
Elevations in EEG theta (4–8 Hz) and delta (0.5–4 Hz) power are classical neural signatures of sleep onset and drowsiness.
Theta and Delta Power Overview
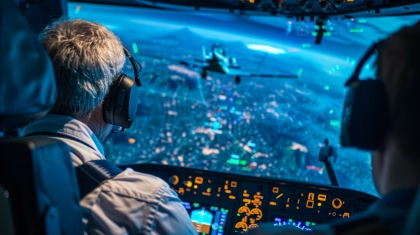
- Popular Industries: sleep research, clinical neurology, high‑risk operator monitoring in military/aviation research, and academic studies.
- Hardware: EEG headsets
- Data Analysis Complexity: moderate-difficult.
- Preprocessing of raw EEG data is essential. Must consider how to identify artifacts and filter out noise.
- Choose computation method, window length, and band-pass filter frequencies
- iMotions Power Spectral Density R Notebook gives metrics for standard frequency bands, including theta and delta. You can choose preprocessing options in iMotions Lab. Power Spectral Density R Notebook is available for transparency, making describing methods for publication straightforward. No coding experience required.
Considerations when using EEG to measure Theta and Delta power
Pros: direct measurement of brain activity with high sensitivity to sleep stages and micro‑sleep events; strong interpretability in research contexts.
Cons: EEG requires contact sensors, may be intrusive for everyday use, and is sensitive to motion and muscle artifact; regulatory and comfort concerns for long‑term field deployment.
Conclusion
Detecting drowsiness works best with combined modalities, coordinating the weakness of one tool with the strength of another, creating a more resilient, context‑aware system. PERCLOS remains a cornerstone for vision‑based monitoring because of its interpretability and real‑time capability, while HRV and EEG add physiological depth for longer‑term trends and sleep‑state detection. Hardware cost, intrusiveness, and analysis complexity vary across methods, so choosing the right mix depends on the application and deployment constraints.
If you’d like a tailored recommendation or a demo showing PERCLOS integrated with synchronized physiological streams (PPG, ECG, EEG, respiration, GSR, and voice), reach out to us — we’ll help you design a solution that fits your research goals.
References
Takashi Abe, PERCLOS-based technologies for detecting drowsiness: current evidence and future directions, SLEEP Advances, Volume 4, Issue 1, 2023, zpad006, https://doi.org/10.1093/sleepadvances/zpad006
M. Patel, S.K.L. Lal, D. Kavanagh, P. Rossiter, Applying neural network analysis on heart rate variability data to assess driver fatigue, Expert Systems with Applications, Volume 38, Issue 6,2011, Pages 7235-7242, ISSN 0957-4174, https://doi.org/10.1016/j.eswa.2010.12.028.
Pan, T., Wang, H., Si, H., Li, Y., & Shang, L. (2021). Identification of Pilots’ Fatigue Status Based on Electrocardiogram Signals. Sensors, 21(9), 3003. https://doi.org/10.3390/s21093003